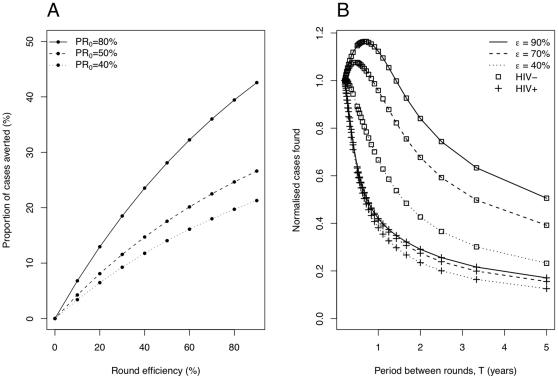
Figure 7. Proportion of cases averted for different round efficiencies and cases found at different periods.
Panel A shows the total proportion of cases over a 10 year time frame averted by yearly case-finding rounds of different efficiency. Parameters are the default of Table 1, but with different initial proportions recent  . Panel B compares for rounds of different efficiency,
  , the influence of round frequency on the number of HIV-infected and HIV-uninfected TB cases found by the active route (normalized by the number of cases actively found at the shortest round period considered).

