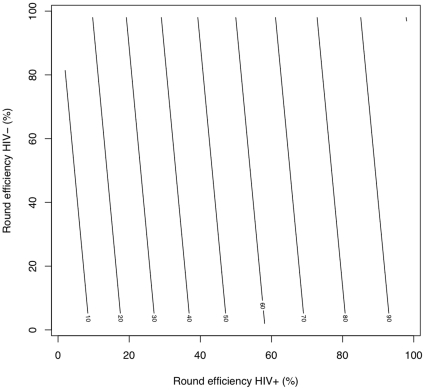
Figure 8. Contours of cases averted for different round efficiencies for HIV-infected and HIV-uninfected TB cases.
These contours are the cases averted (as a percentage of the largest number averted) by yearly rounds with different efficiencies at finding HIV-infected and HIV-uninfected TB. Other parameters are the defaults of Table 1.

