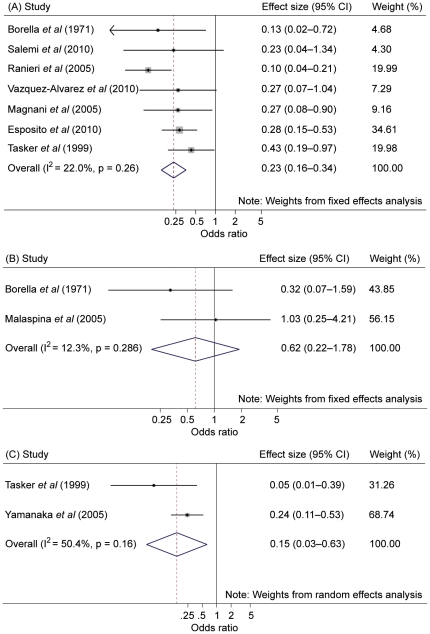
Figure 2. Forest plot for studies on influenza-like illness and laboratory confirmed influenza.
Legend: (A) = influenza-like illness (placebo or no vaccination comparator); (B) = influenza-like illness (vaccinated immunocompetent controls); (C) = laboratory confirmed influenza (placebo or no vaccination comparator). Note that each of the three plots shown has different scaled x-axes.

