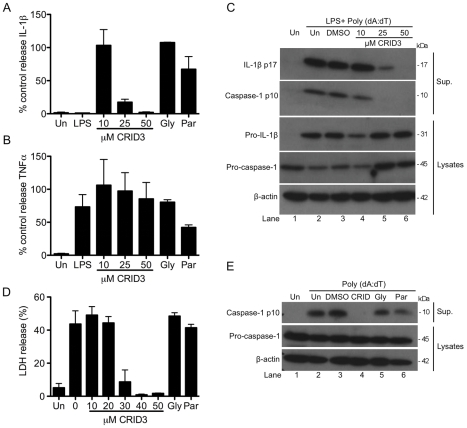
Figure 2. CRID3 inhibits the AIM2 inflammasome.
Primary BMDM were stimulated with 10 ng/ml LPS for 3 h, treated with CRID3 (10–50 µM), 200 µM glyburide, 10 µM parthenolide or DMSO control in serum free media for 1 h followed by transfection of 1 µg/ml Poly (dA:dT) for 4 h (A) and (B) or overnight (C). Supernatants were analysed by ELISA for IL -1β (A) and TNFα (B). (A) and (B) Cytokine level is expressed as a percentage of that released from control treated cells, which ranged across all experiments from 518–2347 pg/ml for IL-1β and 397–1136 pg/ml for TNFα. Data are expressed as mean ± S.E.M of four independent experiments each carried out in triplicate. In (C) concentrated supernatants and cell lysates were analysed by Western blotting using anti-IL-1β, anti-caspase-1 and anti-β-actin antibodies. These results are representative of three independent experiments. (D) and (E) Primary BMDM were treated with CRID3 (10–50 µM), 200 µM glyburide,10 µM parthenolide or DMSO in serum free media for 1 h followed transfection of 1 µg/ml Poly (dA:dT) for 6 h. Supernatants were analysed using an LDH cytotoxicity assay. The data shown represent mean % LDH release ± S.D. from triplicate determinations and are representative of three independent experiments. In (E) Concentrated supernatants and cell lysates were analysed by Western blotting using anti-caspase-1 and anti-β-actin antibodies. These results are representative of four independent experiments.

