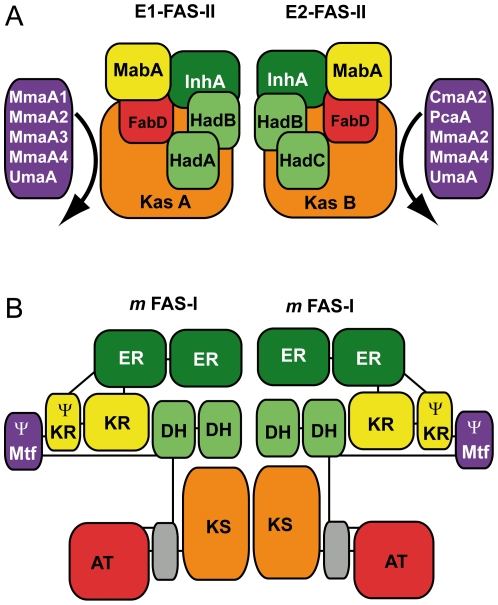
Figure 5. Modular organization of Mtb FAS-II and mFAS-I.
(A) Schematic representation of type-I (E1-FAS-II) and type-II (E2-FAS-II) FAS-II elongation complexes as defined by the analysis of protein interactions in the present work and before [36], [37]. The interactions between the different MA-Mtfs (in violet) and each complex are represented by curved arrows. (B) Schematic representation of a dimer of m-FAS-I adapted from Maier and colleagues [6] and drawn from the 3D structure. For both panels, the enoyl reductase domains (ER) and proteins (InhA) are in dark green, the keto-reductase domains (KR) or pseudo keto-reductase domains (Ψ-KR) and proteins (MabA) are in yellow, the keto-synthase domains (KS) or proteins (KasA, KasB) are in orange, the acyl transferase domains or the MtFabD protein (FabD) are in red, the pseudo-methyltransferase domains (Ψ-Mtf) or the MA-Mtf proteins (CmaA1, CmaA2, MmaA1 to MmaA4, UmaA, PcaA) are in violet, the dehydratase domains (DH) or proteins (HadA, HadB, HadC) are in light green and the mammalian FAS-I linker region (L) are in grey. The links between the domains of mFAS-I in its primary structure are symbolized by straight lines.

