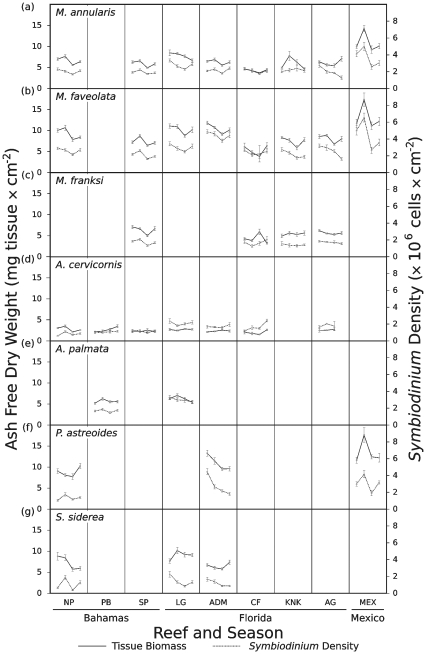
Figure 5. Seasonal variation in coral biomass and Symbiodinium density for seven coral species from nine reefs.
Coral tissue biomass (left axis and solid lines) and Symbiodinium density (right axis and dashed lines) data presented as mean values for a given season ± standard error. Within each line plot, four sample dates are provided, one each for winter (January to March), spring (April to June), summer (July to September) and fall (October to December). Seasonal means are presented chronologically beginning with winter and ending with fall. A blank sub-panel indicates that a particular coral species did not occur at that specific location. Reef abbreviations provided in Fig. 1. Statistical analyses of these data are given in Table S1.

