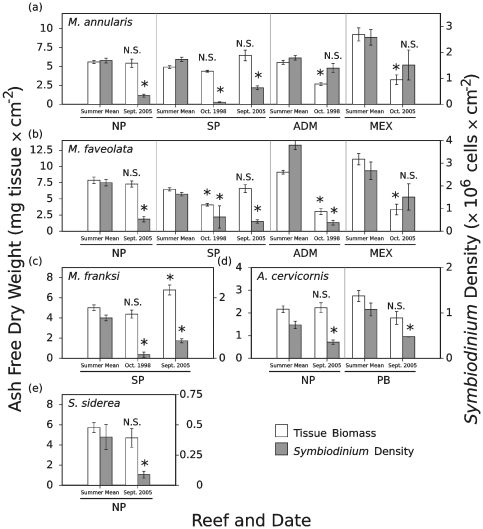
Figure 6. Changes in Symbiodinium density and tissue biomass coinciding with bleaching events for five coral species.
Data are presented as mean values of tissue biomass (left axis and white bars) and Symbiodinium density (right axis and shaded bars) ± standard error. Significant deviation from the mean summer tissue biomass and Symbiodinium density, as evaluated using T-tests, indicated above the histograms for each species (N.S. = no significant difference, * = significant deviation from the summer mean at α = 0.05). Reef abbreviations provided in Fig. 1. Note that bleaching impacts are not provided for certain coral species due to either a lack of sampling during the bleaching events (e.g., certain corals from the Florida Keys during the 1998 bleaching) or due to a lack of visible and statistically significant bleaching for that species and location (e.g., A. palmata from all regions in 2005).

