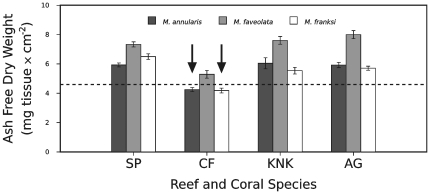
Figure 7. Tissue biomass of Montastraea spp. at 12–15 m depth in relation to colony mortality.
A black arrow indicates that all coral colonies of that species and location died during the course of this study. Data presented as mean values of tissue biomass ± standard error. Coral species identity indicated by bar color (see legend). Reef abbreviations provided in Fig. 1. Dashed line indicates the estimated threshold for mortality susceptibility (see text).

