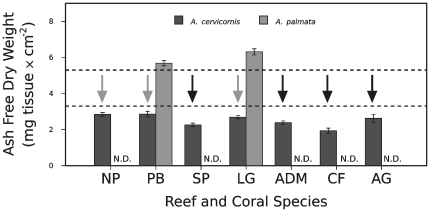
Figure 8. Tissue biomass of Acropora spp. in relation to colony mortality.
A black arrow indicates that all coral colonies of that species and location died during the course of this study. Gray arrows indicate substantial reductions in live coral tissue for all coral colonies from that location. Data presented as mean values of tissue biomass ± standard error. Coral species is indicated by bar color (see legend). The designation ‘N.D.’ (i.e., no data) denotes the lack of a particular coral species at a specific location. Reef abbreviations provided in Fig. 1. Dashed lines demarcate the statistically significant range of thresholds for mortality susceptibility (see text).

