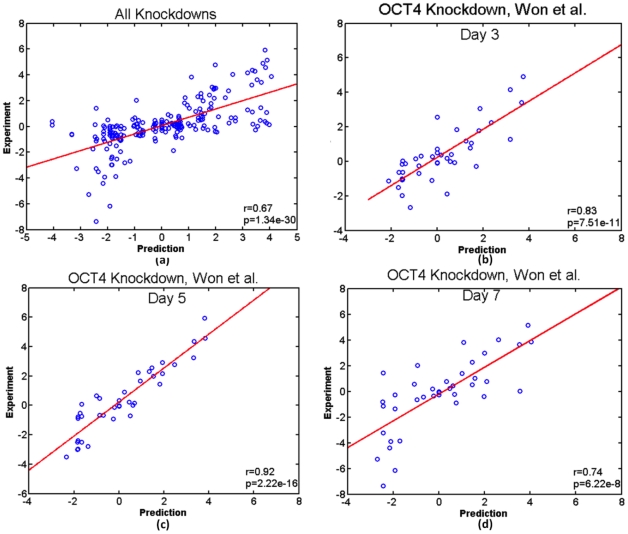
Figure 2. Pearson correlation coefficient (r) and p-value (p) between predicted and experimental gene expression changes (in log2).
(A) A scatter plot of predicted and experimental gene expression changes of all OCT4(Won et al., submitted and [54]) and NANOG knockdown [55] experiments; (B), (C) and (D) Scatter plots of day 3, 5 and 7 after knocking down OCT4 using an episomal vector(Won et al., submitted).

