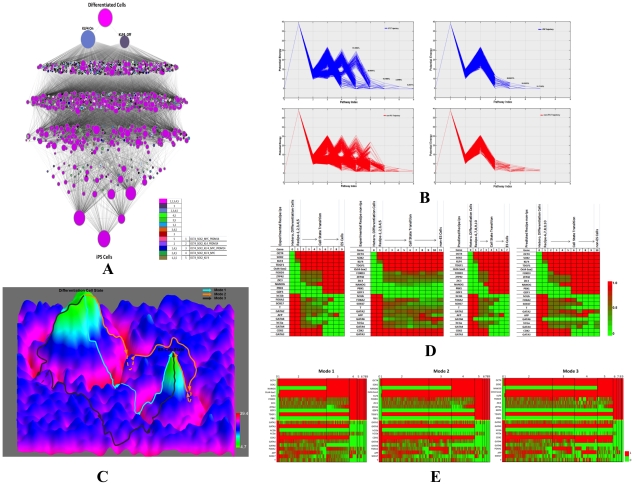
Figure 4. Reprogramming procedure.
(A). State transitions during iPSC generation by the five experimentally confirmed recipes (overexpression of OCT4, SOX2, KLF4, PRDM14, or MYC). Each recipe was sampled 100,000times. For illustrative purposes, each cell state was only defined by the 22 marker genes. The node size is proportional to the dynamical flux, which is defined as the number of paths going through the node. The color of nodes indicates the dynamical path of which experimentally validated recipes going through this node. Note that different reprogramming paths consist of a variable number of states, i.e. different paths pass through a variable number of nodes. (B). Potential changes along the reprogramming paths by the five experimental recipes (left) and experimental recipes plus knockdown of GATA6 (right). Upper (blue lines) and lower (red lines) panels respectively show the paths that converged to the hESC and non-hESC attractors. The numbers indicate the percentages of initial states converged to the hESC attractors at the corresponding steps. X-axis values specify simulation step numbers. (C). Schematic illustration of the three modes of reprogramming by the 5 experimental recipes ( Table 1 ) on the potential landscape (upside down of Figure 1 ). The z-axis specifies the potential energy of a cell state and each cell state is specified by x- and y-coordinates. Mode 1 represents the most efficient (shortest) reprogramming paths spent least steps, mode 2 represents (moderate length) reprogramming pathways spent one extra steps in the valley, and mode 3 represents the least efficient (longest) reprogramming pathway with two extra steps in the valley. (D). Gene expression changes of marker genes during reprogramming. As the simulation progresses, the hESC marker genes are down regulated while the differentiation marker genes are up regulated. The gene expression colors represent averaged values at each step. This analysis was based on experimentally validated reprogramming recipes. (E). Expression of marker genes in the three modes of experimentally validated reprogramming recipes. Each column represents a unique state. The width of each simulation step (from initialization at step 0 to the converged joint probability at step 9) during reprogramming is proportional to the number of distinct cell states at that step: the larger the width, the more distinct cell states.

