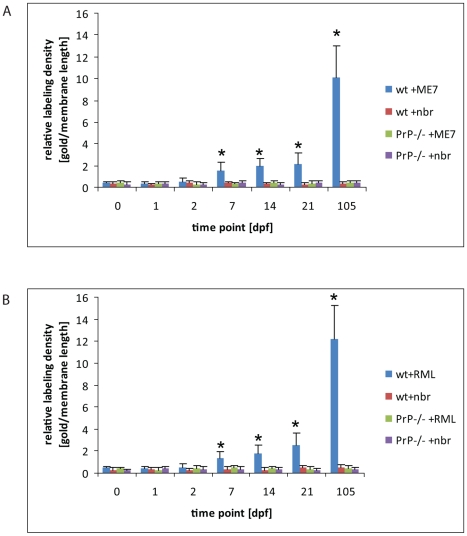
Figure 6. An increase of PrP label upon FDCs of wt mice only.
Quantification of PrP label on the plasma membrane of FDCs indicates a clear increase of PrP label in wt mice between 2 and 7 dpf with either ME7 (A) or RML (B) prions compared to wt and PrP-/- animals that were fed with normal brain homogenate (nbr) or PrP-/- animals fed with ME7 or RML prions, respectively. The labelling density was counted as gold particles/membrane length (µm). The x axis indicates the number of days after oral infection at which samples were taken. A gold particle was defined as membrane associated if it was not further than 20 nm away from the membrane leaflet. The two most proximal Peyer's patches per mouse and two mice per group were analysed. Only plasma membranes of cells with typical FDC morphology in GCs (cells with lightly electron-lucent, bilobular nucleus that were in cellular contact with ≥1 non-apoptotic lymphocytes) were counted. A total membrane length of 1000 µm per sample was analysed. Asterisks indicate a statistically significant difference between wt mice infected with prions compared to other groups, p<0,05.

