
Figure 4.
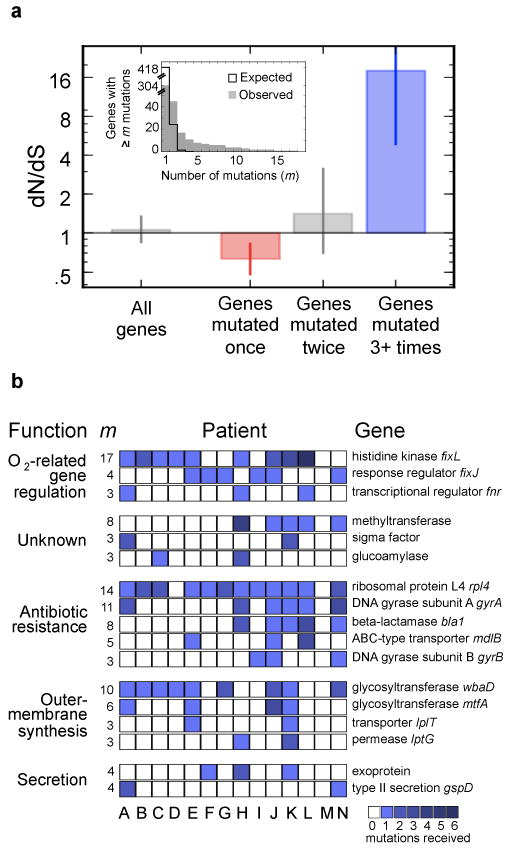
Parallel evolution identifies a set of genes under strong selection during pathogenesis. a, Inset, The number of genes that acquired at least m mutations across the epidemic is plotted as a function of m (gray bars). This distribution contrasts sharply with the distribution expected for neutral evolution (black line). Under neutral evolution, the expectation is that only one gene would receive three or more mutations (m>3); instead, we observed 17 such genes. Main, The canonical signal for selection (dN/dS) is calculated for these 17 genes (109 mutations in these 17 genes), the 28 genes with m=2, and the 247 genes with m=1 (Supplementary Fig. 3 presents the contribution of these mutations to the molecular clock). Values of dN/dS greater than 1 indicate positive selection (blue), values smaller than 1 indicate purifying selection (red). Error bars indicate 95% CIs. Calculated over all genes without regard to m, this analysis would not show a signal for selection. b, Each one of the 17 genes (rows) under positive selection contained an acquired mutated in several patients, signified by squares (color intensity indicate the number of mutations observed within this patient). The total number of mutations observed within that gene, m, is indicated left. Genes are grouped by biological function, and labeled with the annotations of close homologs, and, when available, close homolog names.