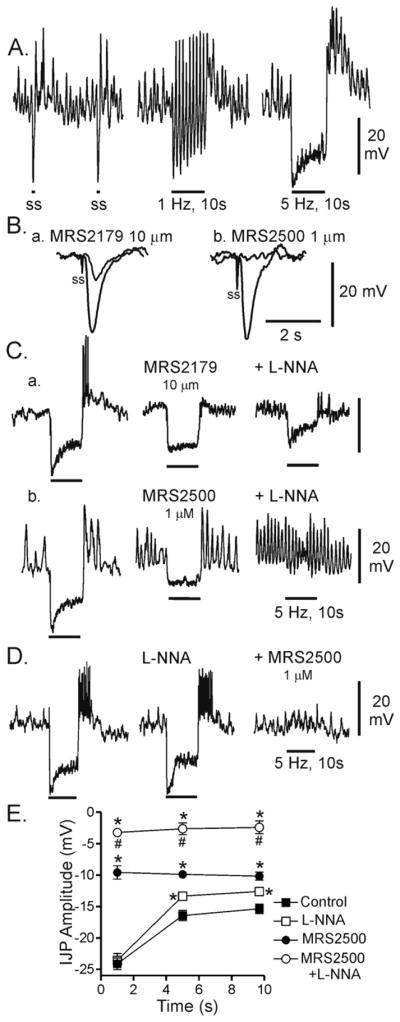
Figure 1. Effect of various blockers on inhibitory junction potentials in the WT mouse IAS.

(A) Sample traces showing IJPs elicited with 0.05 Hz (left), 1 Hz (middle) and 5 Hz (right) EFS for 10s. Peak IJP amplitude always occurred with the first stimulus. Each stimulus in these recordings gives rise to rebound depolarization at 0.05 and 1 Hz whereas at 5 Hz rebound depolarization is limited to the end of the stimulus train. (B) Superimposed traces showing the effect of either MRS2179 (10 μM; Ba) or MRS2500 (1 μM; Bb) on IJPs elicited with a single shot (ss) electrical stimulus. L-NNA (100 μM was present throughout. While MRS2179 reduced IJPs (Ba), MRS2500 abolished them (Bb). (C) Sample traces showing composite IJPs elicited with 5 Hz EFS for 10s. Control composite IJPs (Ca,b left traces) were reduced by either MRS 2179 (Ca) or MRS2500 (Cb) (middle traces). However a residual purinergic component is apparent with combined addition of L-NNA (100 μM) and MRS2179 Ca), while the composite IJP is abolished with combined addition of L-NNA with MRS2500 (Cb) (right traces). (D) Sample traces showing the effect of first blocking nitrergic NMT on the composite IJP. Whereas there was a small reduction in the sustained component with L-NNA, the peak hyperpolarization was not reduced. (E) Summary graph of the effects of various blockers on the amplitude of the IJP measured during three different time periods (see methods for further details). Under control conditions (■, n=13), peak hyperpolarization occurs during the initial time period and this is followed by a smaller, more sustained period of hyperpolarization (second and third values). L-NNA (□, n=5) did not reduce peak IJP amplitude while the sustained component (second and third values) was significantly reduced (*, p<0.05). In contrast, MRS2500 (●, n=8) significantly (*) reduced IJP amplitude during all three time periods. Combined MRS2500 and L-NNA (○, n=10) significantly reduced IJP amplitude below the control level (*) and below the level observed with MRS2500 alone (#). All muscles were pre-exposed to 25 μM wortmannin for 20 min followed by at least 1 hour wash out before beginning experiments. Shown are mean values ±S.E.M.
