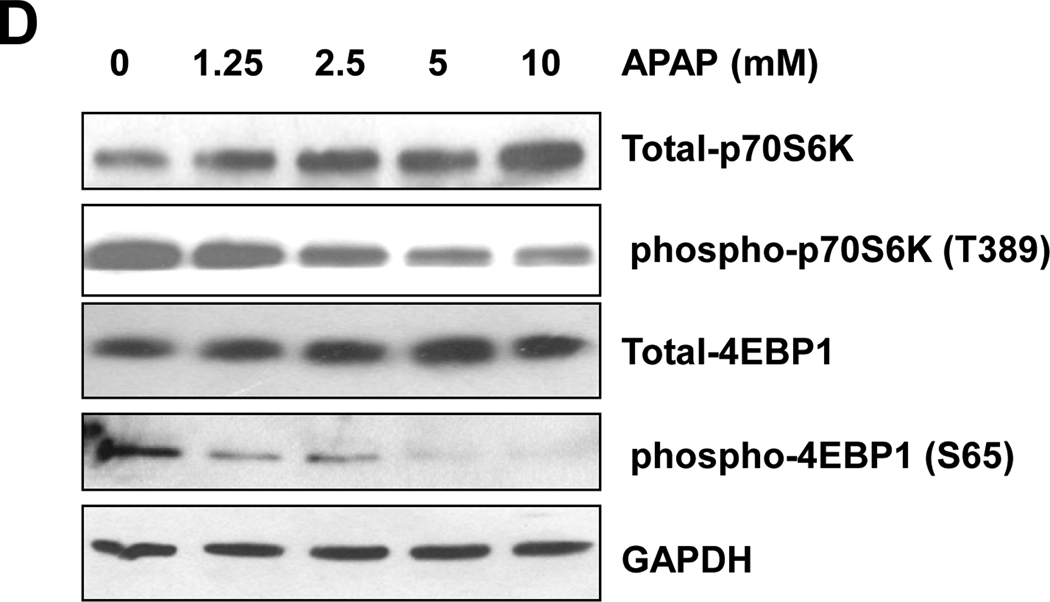
Figure 3. APAP induces autophagic flux and suppresses mTOR in primary mouse hepatocytes.
(A) Ad-GFP-LC3 infected hepatocytes were treated with APAP (5 mM) in the absence or presence of CQ (20 µM) for 6 hrs and examined by fluorescence microscopy. Scale bar: 20 µm. (B) GFP-LC3 puncta (mean ± SEM) were quantified for each experiment (n=3). At least 30 cells were counted in each individual experiment *: p<0.01. (C)Total lysates were subjected to immunoblot assay for LC3 and p62. (D) Primary mouse hepatocytes were treated with different concentrations of APAP (0, 1.25, 2.5, 5 & 10 mM) for 6 hrs. Total cellular lysates were subjected to immunoblot assay.


