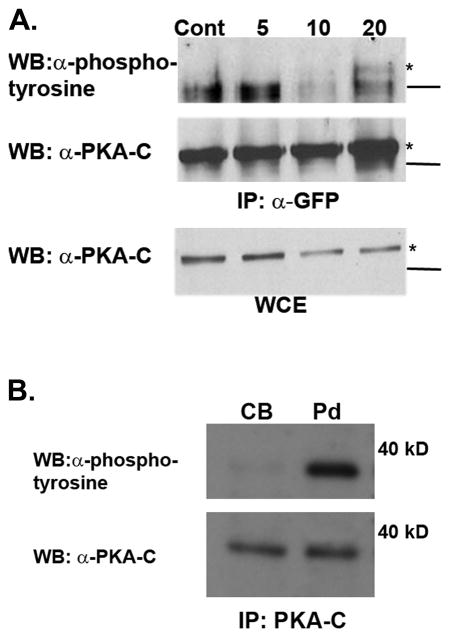
Figure 2.
(A) Cos7 cells were transfected with a plasmid encoding PKA-Cα fused to YFP. Twenty four hours later cells were serum starved overnight and then treated with vehicle control (Cont) or EGF (100 ng/mL) for 5, 10 or 20 minutes after which they were harvested in mRIPA buffer. The PKA-Cα-YFP fusion protein was immunoprecipitated, then subjected to SDS-Page and immunoblot analysis using antibodies directed against pan-phosphotyrosine (upper panel) and the catalytic subunit of PKA-Cα (middle panel). The lower panel illustrates the amount of PKA-C-α–YFP in the whole cell extract and is equivalent to 1/20th the input. The lines to the right represent the position of a 60 kD molecular weight marker and the asterisk (*) denotes the PKA-Cα-YFP fusion protein. The experiment was repeated three times and yielded similar results. (B) Cell bodies (Cb) and pseudopods (Pd) were isolated from NIH3T3 cells as described in Materials and Methods. PKA-Cα was immunoprecipitated from each of these fractions, separated by SDS-PAGE, and immunoblotted with antibodies against pan-phosphotyrosine and the C subunit (PKA-C). The numbers to the right indicate the position of a 40 kD molecular weight marker. The result shown is representative of two separate experiments.

