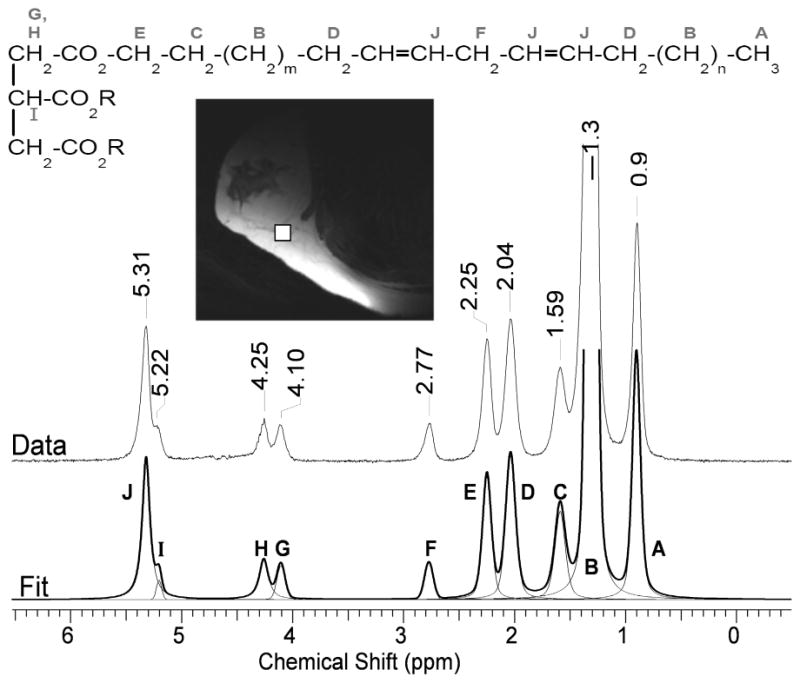
FIG. 1.

Proton NMR spectrum of the breast adipose tissue of a 19 year old volunteer at 7T. Ten resonances (A–J) are typically resolved. The letter assignment on the spectrum is also shown on the corresponding chemical structure of a triglyceride. The bottom trace shows the overall fitted spectrum (thick line) composed of the individual Voigt peaks (thin lines). The upper trace is the acquired data. The insert shows a T2-weighted image of the position of the spectral voxel in the breast.
