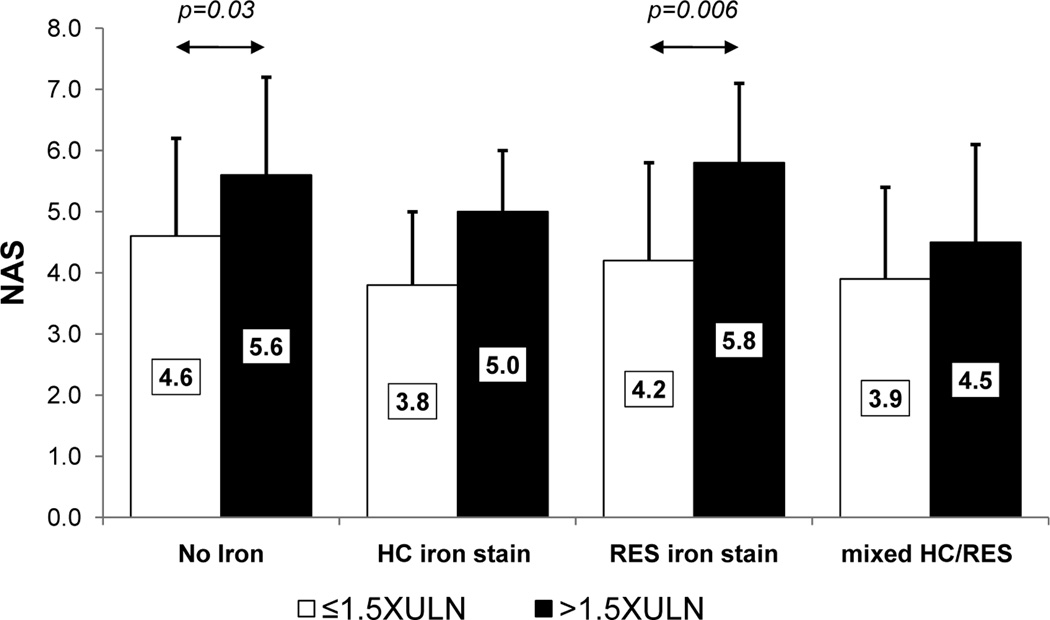
Figure 2. Relationship between NAS, level of serum ferritin and presence and pattern of iron staining among subjects.
The mean NAS values are shown for subjects above and below SF 1.5XULN according to each hepatic iron deposition pattern including subjects without iron deposition; HC, RES and mixed HC/RES groups. Significant differences between groups, determined using multivariate ordinal regression modeling after controlling for the covariates BMI, age, sex, type 2 diabetes and serum ALT level, are indicated by arrows. Standard deviations are indicated by the error bars.

