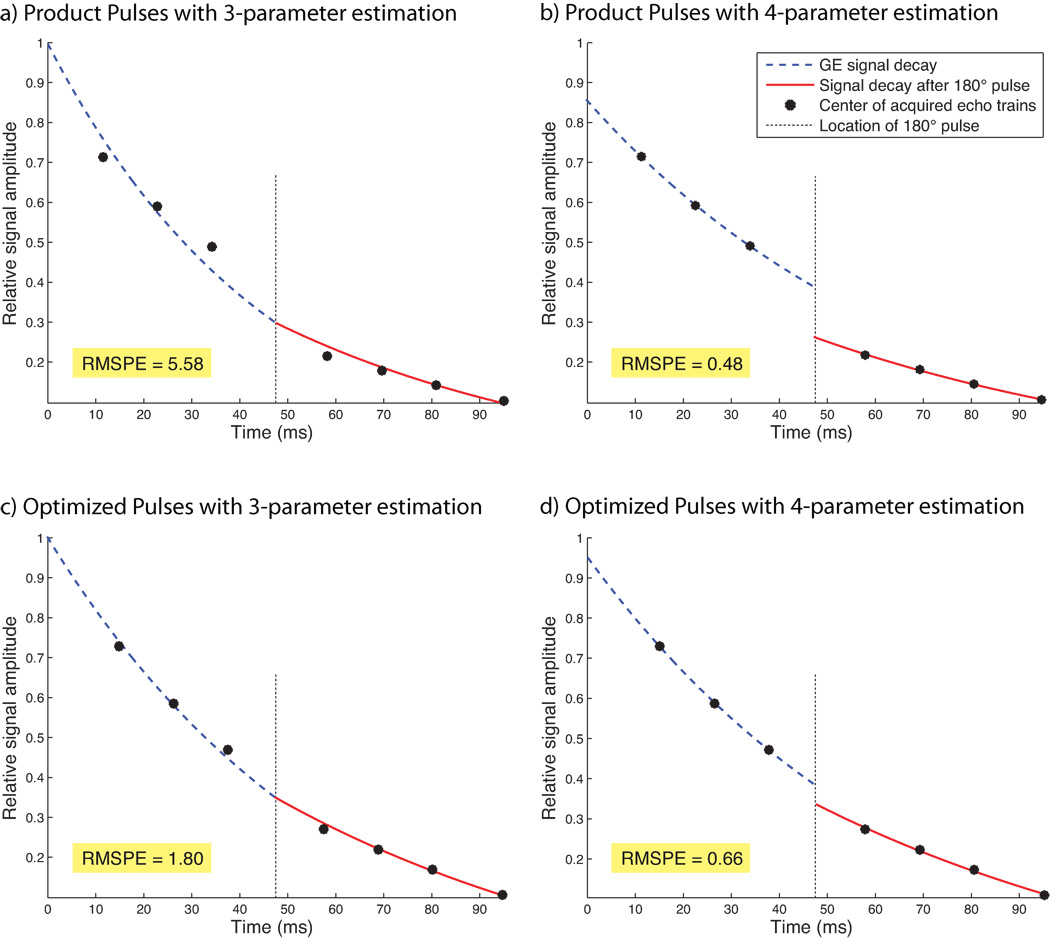
Fig. 6.
Estimations of R2 and R2* in an ROI within gray matter in the human brain using product pulses (a,b) and optimized pulses (c,d). The left column (a,c) shows results using 3-parameter estimation without correction for slice profile mismatches, whereas the right column (b,d) shows results using the 4-parameter estimation with correction for slice profiles mismatches. Shown in blue is the gradient-echo signal decay prior to the refocusing pulse, and shown in red is the signal decay after signal refocusing. The corrected MR signal decay (4-parameter estimation) experienced a sudden step at the location of the 180° pulse. This step accounts for mismatched slice profiles; its size is characterized by the parameter δ. With optimized pulses (cf. d), the step is much smaller, indicating a better match between RF pulses.

