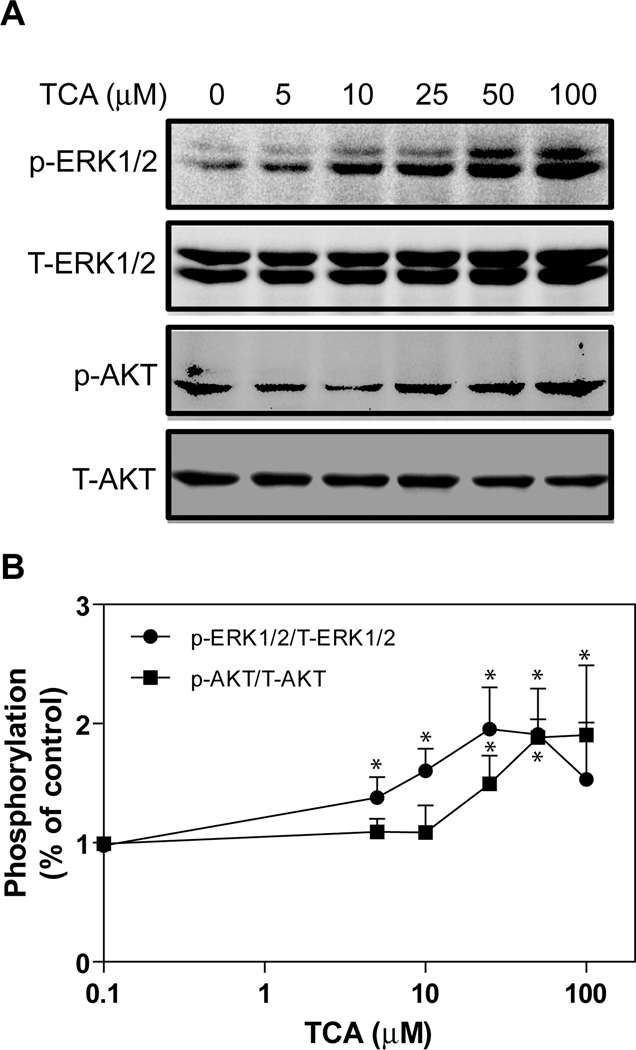
Fig. 2. Saturation curves of TCA-induced ERK1/2 and AKT activation in primary rat hepatocytes.
Primary rat hepatocytes were treated with different amounts of TCA (0, 5, 10, 25, 50 and 100 µM) for 30 minutes. The cells were harvested to prepare total cell lysates. The protein levels of phosphorylated ERK1/2 (p-ERK1/2) and AKT (p-AKT) were determined by Western blot analysis and normalized with total ERK1/2 (T-ERK1/2) and total AKT (T-AKT) as described in Materials and Methods. A. Representative images of Western blots of p-ERK1/2, T-ERK1/2, p-AKT, and T-AKT. B. Saturation curves of TCA-induced ERK1/2 and AKT activation. *p<0.05 compared to control, n=4.

