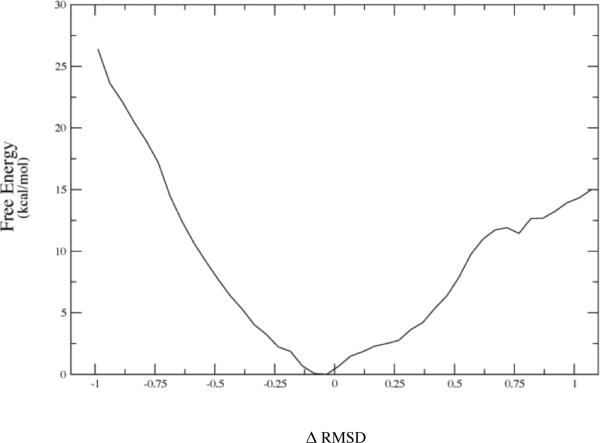
Figure 5b.
The converged free energy corresponding to one of the potential energy curves above (red curve labeled 7–90.) Note that the minima in average potential energy are on the edges of a rising free energy. The minima on Figure 5a given in string images correspond to −.50 and + .69 angstroms in Δ-RMSD units along the string coordinate on 5b.

