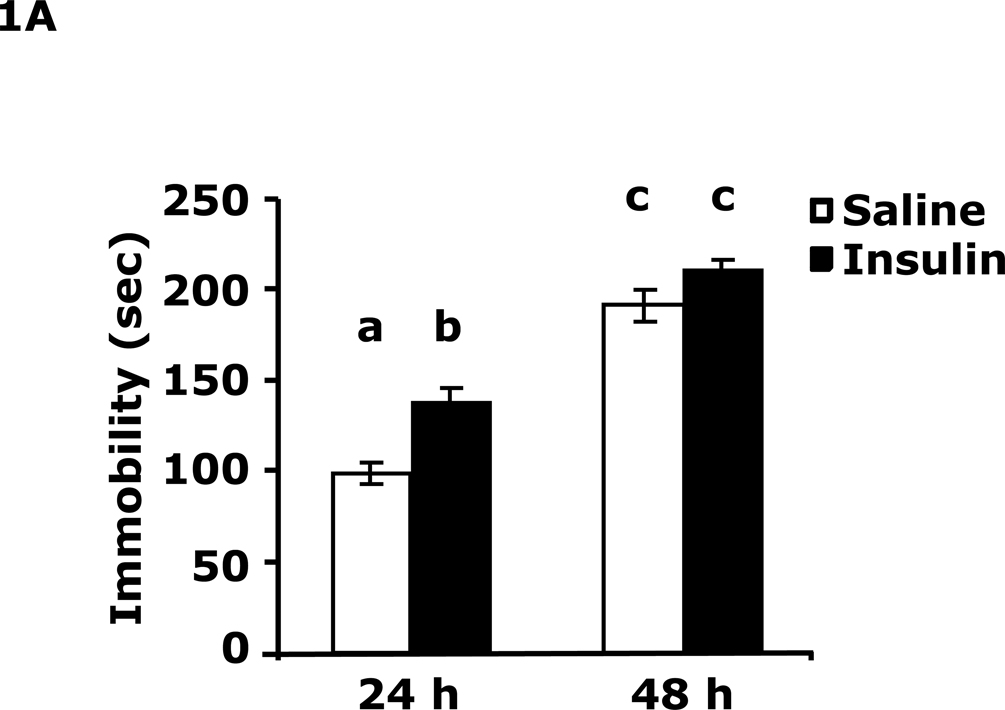
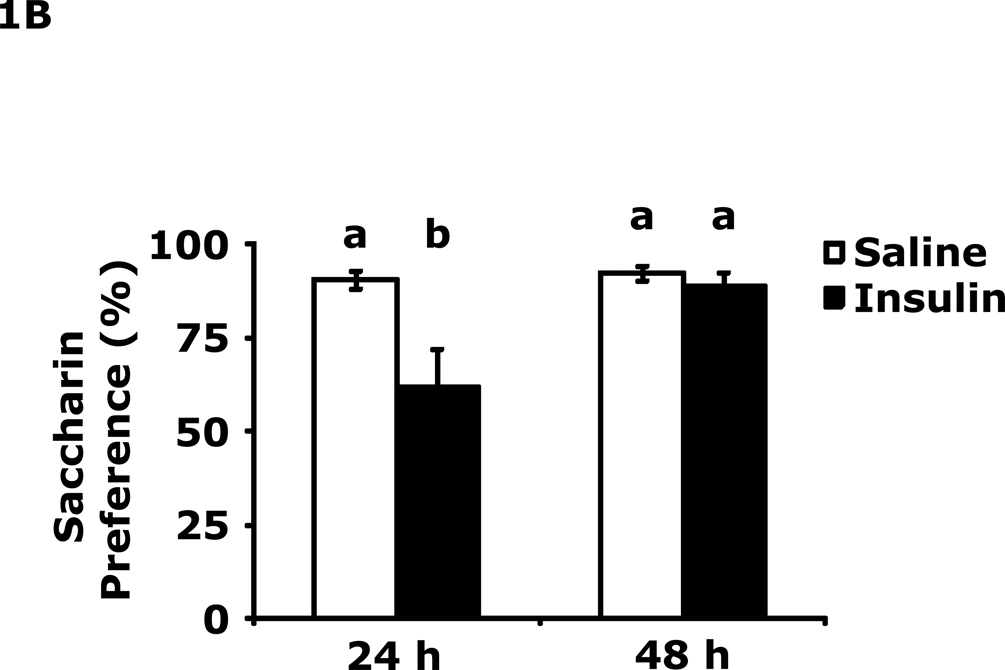
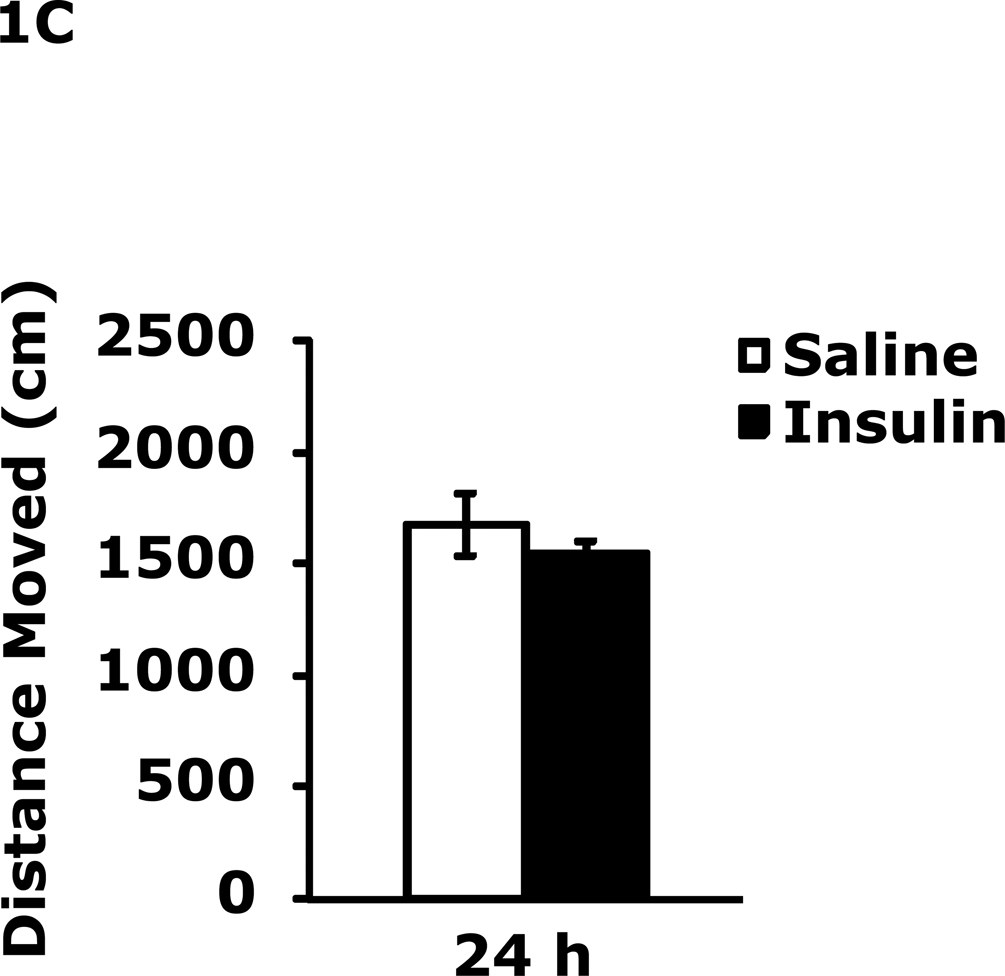
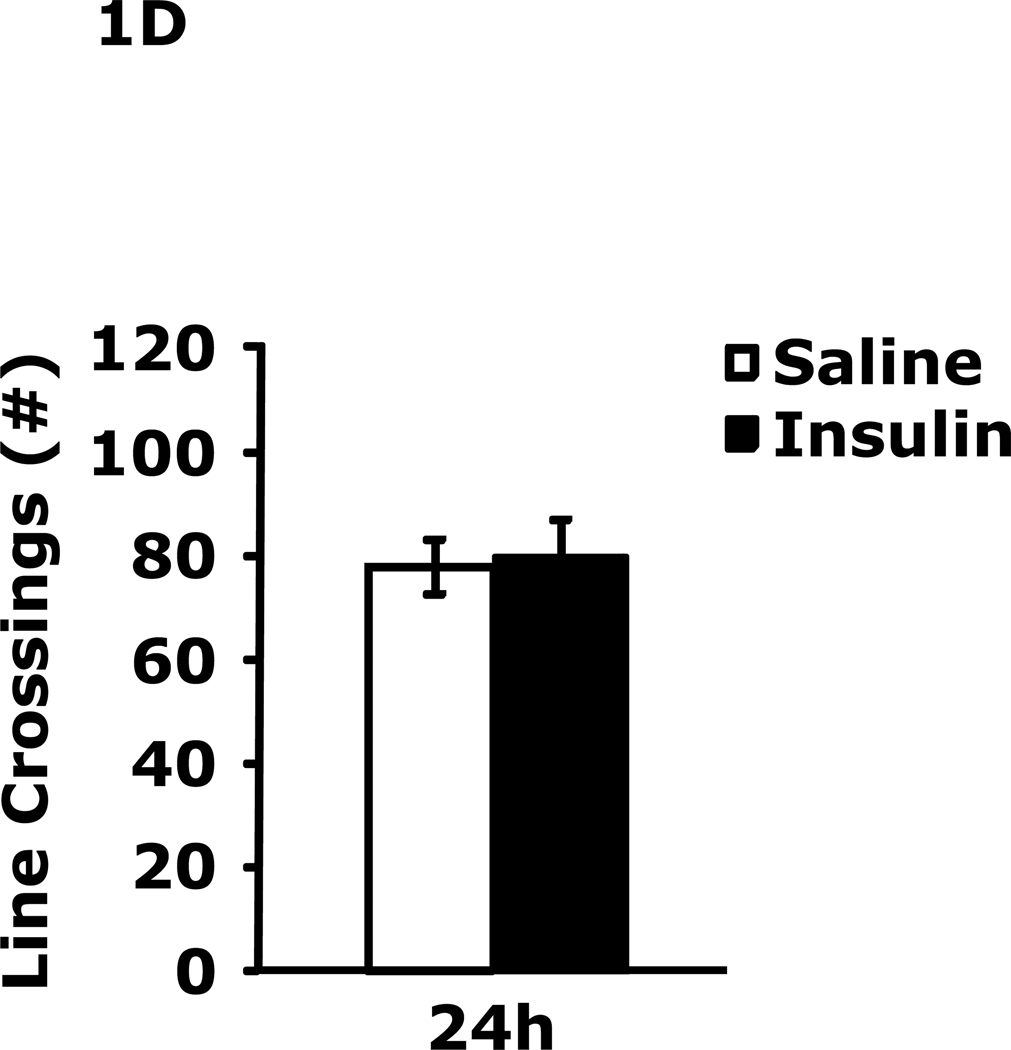
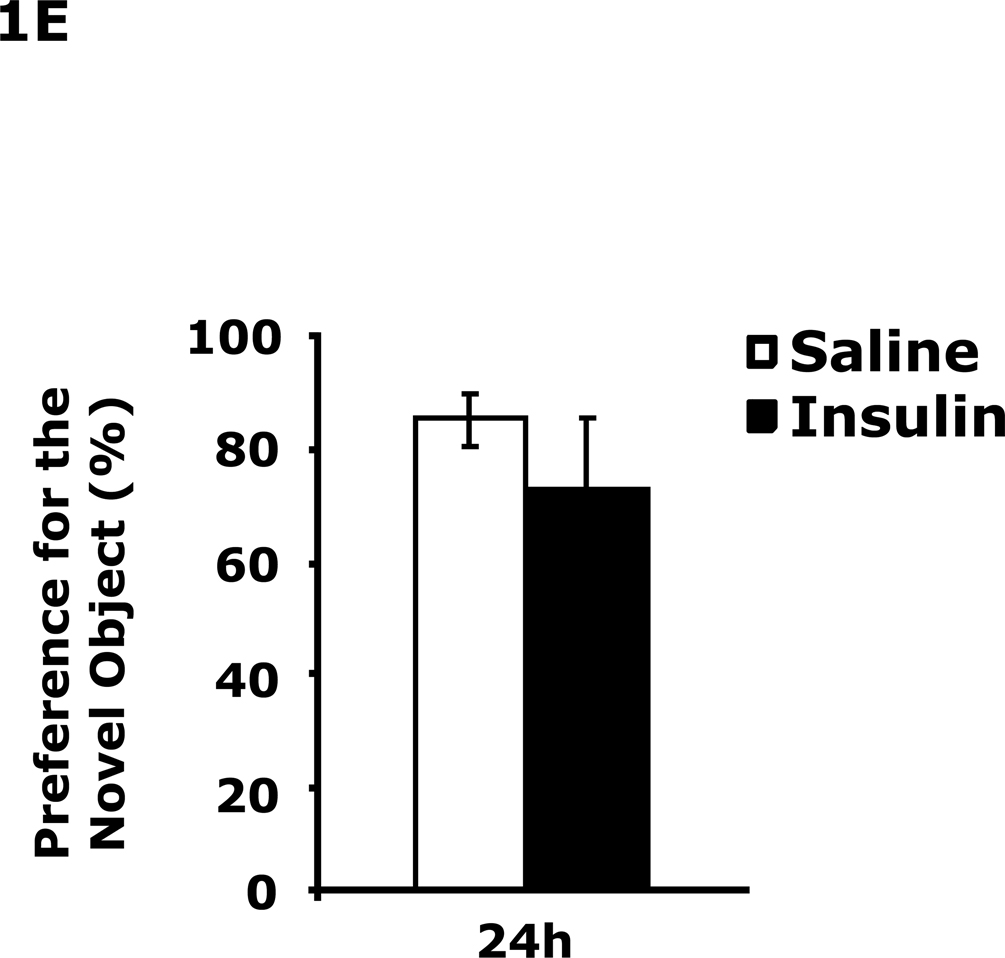
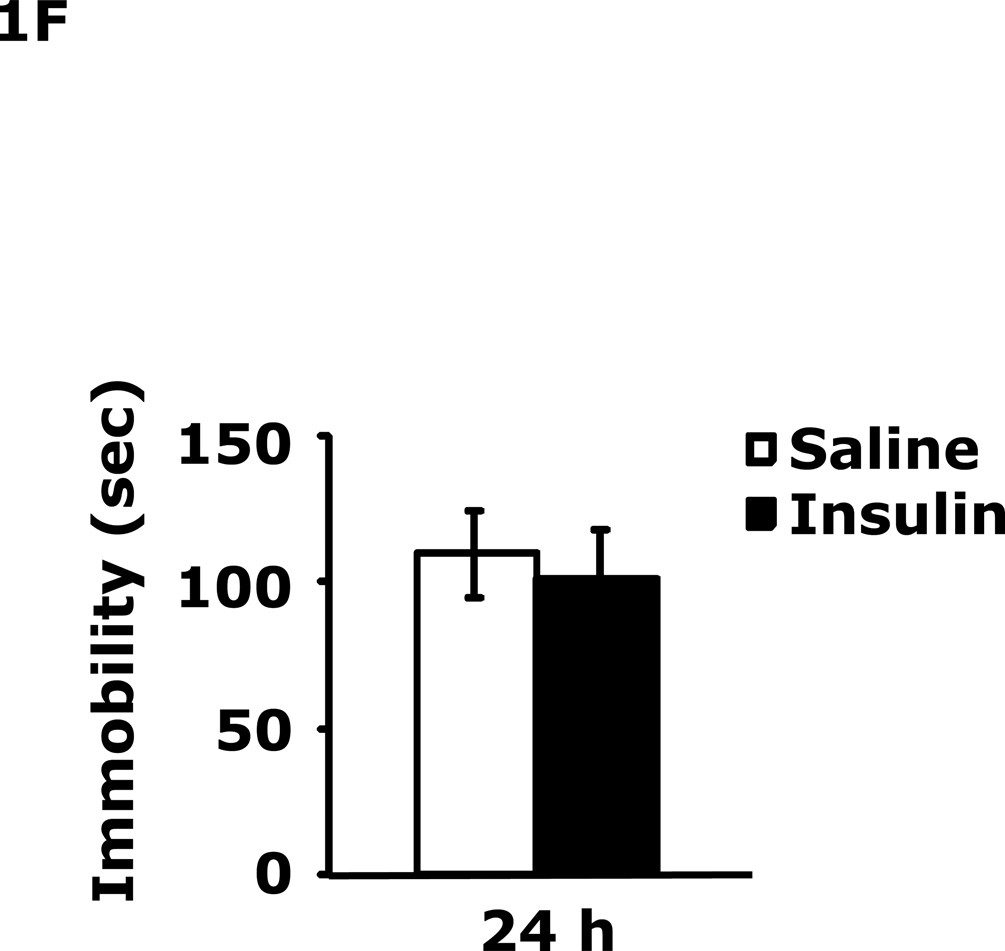
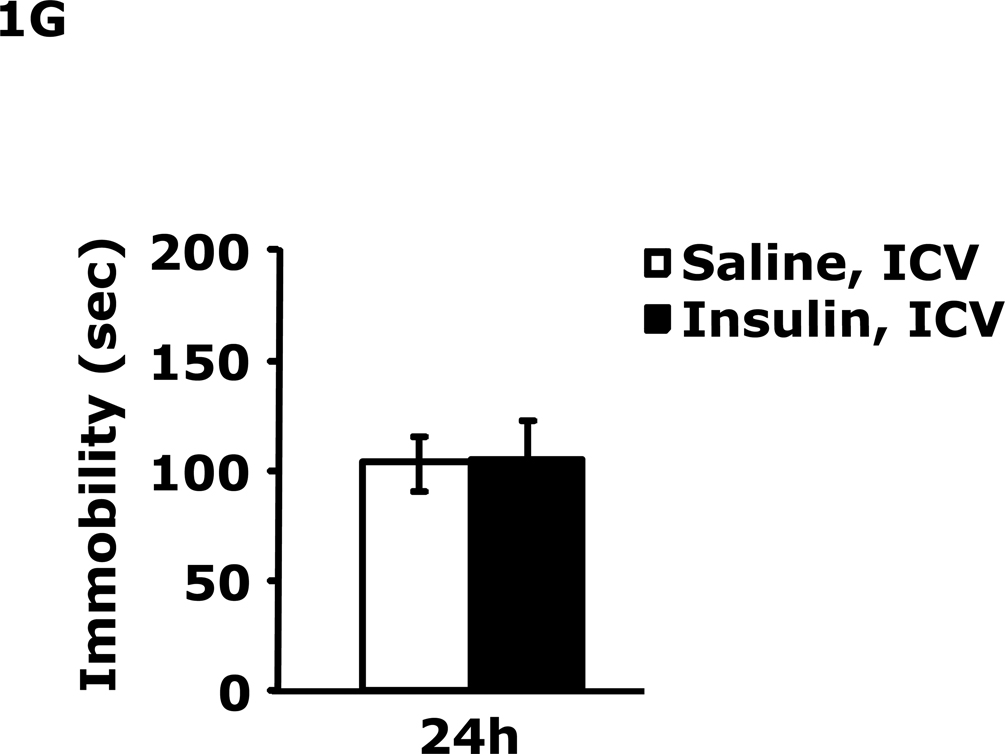
Fig. 1. Depressive-like behaviors but not movement or memory deficits exist 24 h after insulin-induced hypoglycemia.
A, After a 12 h fast, mice were administered either saline or insulin IP. Immobility in the FST was measured at 24 h and 48 h after saline or insulin injection. Results are expressed as mean ± SEM; n=14–15/group. Two-way ANOVA revealed main effects of treatment (p=0.003) and time (p<0.001). Bars without a common superscript letter are different (p<0.05). B, After a 12 h fast, mice were administered either saline or insulin IP. Saccharin preference was measured at 24 h and 48 h after saline or insulin injection. Results are expressed as mean ± SEM; n=4/group. Two-way ANOVA revealed main effects of treatment (p=0.0482), time (p=0.0118) and treatment-time interaction (p=0.0196). Bars without a common superscript letter are different (p<0.05). C, After a 12 h fast, mice were administered either saline or insulin IP. Locomotor activity was measured 24 h after saline or insulin injection. Results are expressed as mean ± SEM; n=4–8/group. D, After a 12 h fast, mice were administered either saline or insulin IP. Line crossings were measured 24 h after saline or insulin injection. Results are expressed as mean ± SEM; n=4–8/group. E, After a 12 h fast, mice were administered either saline or insulin IP. Novel object recognition was measured 24 h after saline or insulin injection. Results are expressed as mean ± SEM; n=4–8/group. F, Un-fasted mice were administered either saline or insulin IP. Immobility in the FST was measured at 24 h after saline or insulin injection. Results are expressed as mean ± SEM; n=3–4/group. G, After a 12 h fast, mice were administered either saline or insulin ICV. Immobility in the FST was measured at 24 h after saline or insulin injection. Results are expressed as mean ± SEM; n=3–4/group.

