Figure 2.
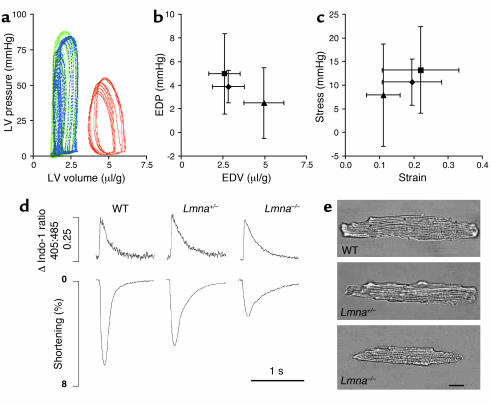
In vivo analyses of cardiac function with micromanometry and sonomicrometry in mice aged 4–6 weeks. (a) Representative LV pressure-volume loops recorded at steady state are shown for WT (blue), Lmna+/– (green), and Lmna–/– (red) mice. Steady-state LV end-diastolic pressure (EDP) plotted against LV end-diastolic volume (EDV) (b) and stress-strain relationships (c) for WT (diamonds, n = 9) Lmna+/– mice (squares, n = 11), and Lmna–/– mice (triangles, n = 6). Volume data are normalized to body weight; data are shown as mean ± SD. Functional and morphologic characteristics of cardiac myocytes isolated from mice aged 4–6 weeks were also assessed. (d) Representative recordings of Ca2+ transients (top panel) and shortening (lower panel) in single myocytes. Intracellular Ca2+ concentration was measured as the change in the 405:485 nm emission ratio for Indo-1. 0.25 represents the magnitude of the Ca2+ transient. Lmna–/– myocytes have similar baseline and peak intracellular Ca2+ concentrations to WT and Lmna+/– myocytes but significantly reduced shortening. (e) Lmna–/– myocytes are shorter and thinner than WT and Lmna+/– myocytes but the length/width ratios are similar. Scale bar: 20 μm.

