
Figure 2.
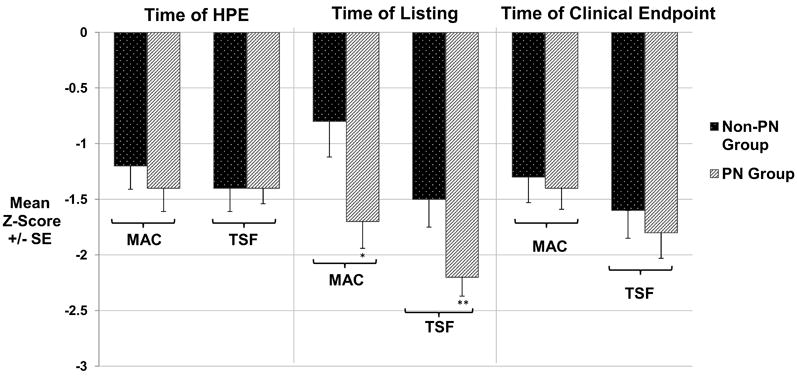
Comparison of MAC and TSF Thickness between PN and Non-PN Groups. MAC and TSF thickness were similar in PN and Non-PN groups at the time of HPE. However, by the time of listing for transplantation MAC and TSF were significantly lower in the PN group compared to the Non-PN group (*p=0.01 and **p=0.001). At the time of clinical endpoint, because both MAC and TSF had improved in the PN group, there was no difference in MAC and TSF between the PN and Non-PN groups. MAC=mid-arm circumference, TSF=triceps skin fold, PN=parenteral nutrition, Clinical Endpoint=transplant, death, or removal from transplant waiting list.