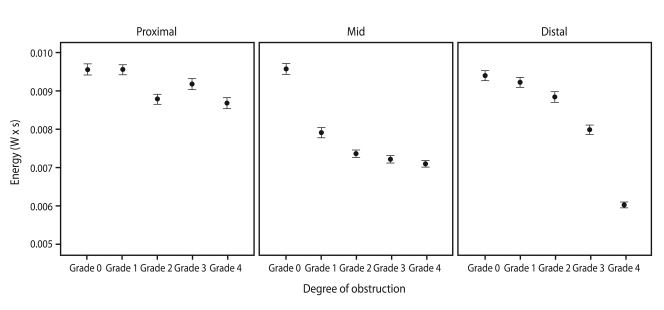
Figure 4.
Energy was associated with obstruction location, decreasing at an increasing rate from the proximal to the distal area of the tube. The β values of proximal, mid, and distal obstruction were -2.13 × 10⁻⁴ (95% confidence interval [CI], -2.58 × 10⁻⁴ to -1.69 × 10⁻⁴; p < 0.001), -5.66 × 10⁻⁴ (CI, -6.18 × 10⁻⁴ to -5.13 × 10⁻⁴; p < 0.001), and -8.01 × 10⁻⁴ (CI, -8.60 × 10⁻⁴ to -7.42 × 10⁻⁴; p < 0.001) respectively. The rate of decline was statistically significant (p for interaction < 0.001).

