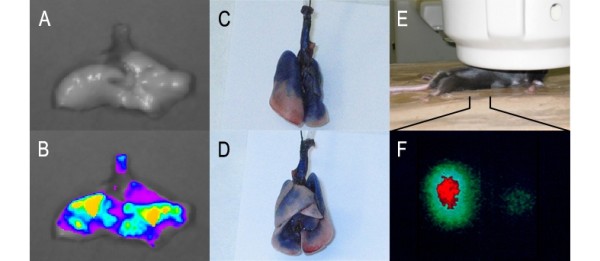
Figure 1.

Distribution of particles after i.t. instillation in wild-type mice. Image A (front) and B (back) show the staining in the lung of mice after i.t. instillation of 1% Evans Blue solution (50 μl/mouse). Image C (no filter) and D (recorded as fluorescence passed through a 620 nm band pass filter) are images of the lung from a mouse after i.t. instillation of quantum dot QD621 solution (50 μl/mouse). Image E and F have been obtained in a single photon emission tomograph γ-camera in a mouse i.t. instilled with 18 nm nanogold particles.
