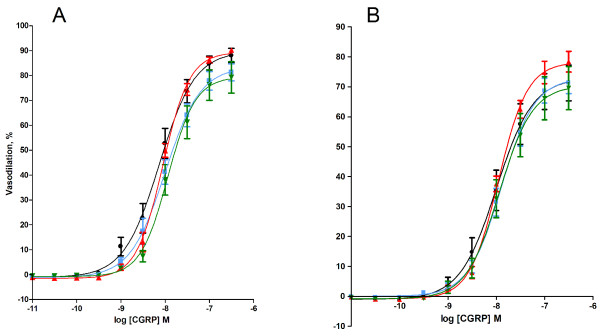
Figure 3.
Calcitonic-gene related peptide (CGRP)-induced vasodilation of aorta segments from ApoE-/- mice exposed by intratracheal instillation to control solution consisting of 90% saline and 10% BAL fluid (black), nTiO2 (green), fTiO2 (blue), or pTiO2 (red). The measurements are performed in A) absence or B) ex vivo presence of the SOD mimic, tempol. The response is expressed as the percent vasodilation of the precontraction tension produced by PGF2α. Each point on the curves represents the cumulative response at each concentration of the vasodilator. Data are expressed as means ± SEM (n = 10-11). * P < 0.05 (ANOVA) compared with Emax values in tempol-treated aorta segments of control mice.

