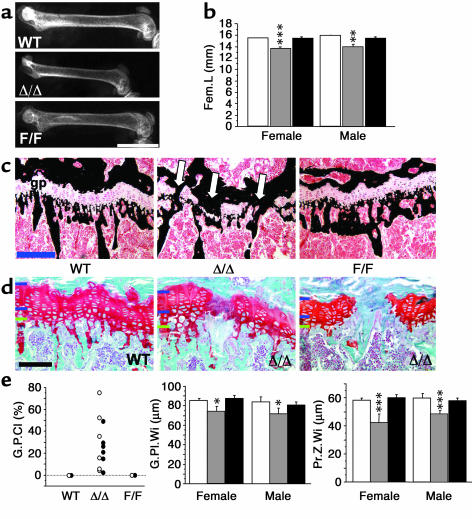
Figure 1.
Impaired bone growth in gp130ΔSTAT/ΔSTAT mutant mice. (a) Representative images of x-rays of female 16-week-old WT, gp130ΔSTAT/ΔSTAT (Δ/Δ), and gp130Y757F/Y757F (F/F) femurs showing differences in bone size. Scale bar (white): 5 mm. (b) Femoral length (Fem.L) in female and male WT (white bars), Δ/Δ (gray bars), and F/F (black bars) mice. (c) Representative images of Von Kossa–stained growth plates (gp), showing calcification (black) from WT, Δ/Δ, and F/F mutant mice. Note regions of calcified bridge formation across the growth plate in Δ/Δ (arrows). Scale bar (blue), 200 μm. (d) Higher-power images of Safranin O–stained growth plates (cartilage-specific mucopolysaccharides stain orange). Shown are a WT growth plate and two examples of growth plate closure in Δ/Δ mice. Note the reduction in thickness of the proliferating zone (denoted by blue bars on the left of each micrograph), and normal hypertrophic zone thickness (lower blue bar to green bar) in the regions where the growth plate is not yet closed. Scale bar (black), 100 μm. (e) Percentage G.P.Cl, G.Pl.Wi, and chondrocyte Pr.Z.Wi in female and male WT and gp130 mutant mice. All values are mean ± SEM from a minimum of eight mice per group at 12–16 weeks of age. *P < 0.01; **P < 0.01; ***P < 0.001 vs. WT of the same sex.

