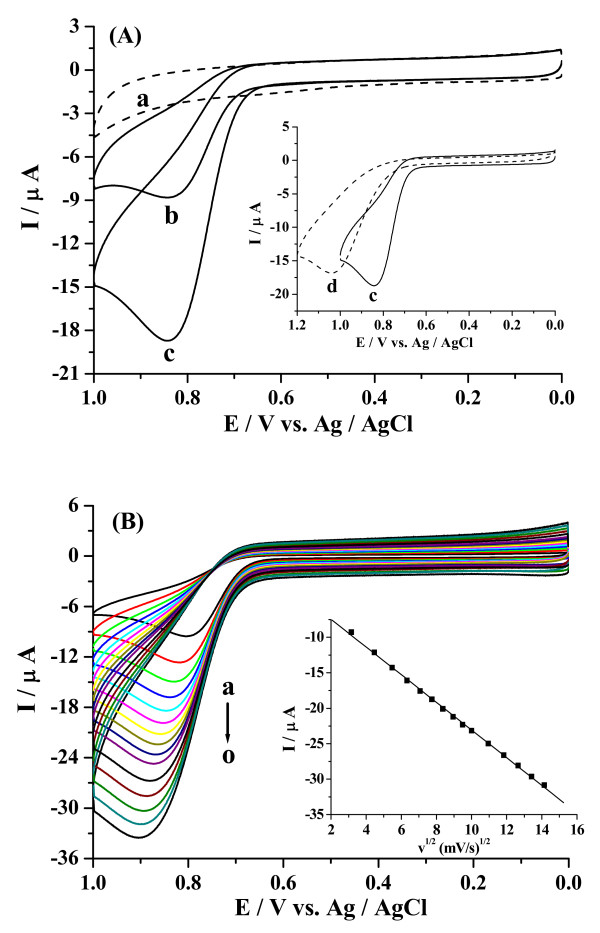
Figure 5.
(A) CVs of in 0.1 M PBS of pH 7.0 for CuO/GCE in various concentrations: (a) 0 mM, (b) 0.5 mM, (c) 1 mM at the scan rate of 50 mV/s. Inset: CVs of 1 mM at CuO/GCE (c) and bare GCE (d) in the same condition. (B) CVs of 1 mM at the CuO/GCE in deoxygenized 0.1 M PBS (pH 7.0) at different scan rates (from inside to outside: a → o: 0.01, 0.02, 0.03, 0.04, 0.05, 0.06, 0.07, 0.08, 0.09, 0.10, 0.12, 0.14, 0.16, 0.18, 0.20 V/s, respectively). The linear dependence of peak current with the square root of scan rate was shown in the inset.

