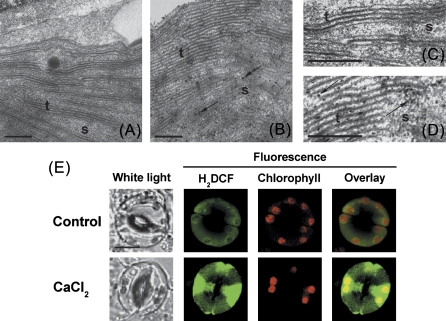
Fig. 2.
Ca2+o-induced H2O2 accumulation in guard cell chloroplasts from Arabidopsis. (A, B) TEM images of chloroplasts in guard cells with CeCl3 staining from a leaf section incubated in 50 μM (A) or 2 mM (B) CaCl2. (C) Further detail of A. (D) Further details of B. The black spots in the TEM images represent H2O2 forming electron-dense cerium perhydroxide precipitates. Examples of individual precipitates are shown by arrows. s, stroma; t, thylakoids. Bar=200 nm. (E) Confocal images of changes in H2DCF fluorescence intensity from guard cell chloroplasts of the wild type in response to 50 μM (control) and 2 mM CaCl2. H2DCF, chlorophyll, and overlay fluorescence images from guard cell are shown. Bar=10 μm. (This figure is available in colour at JXB online.)

