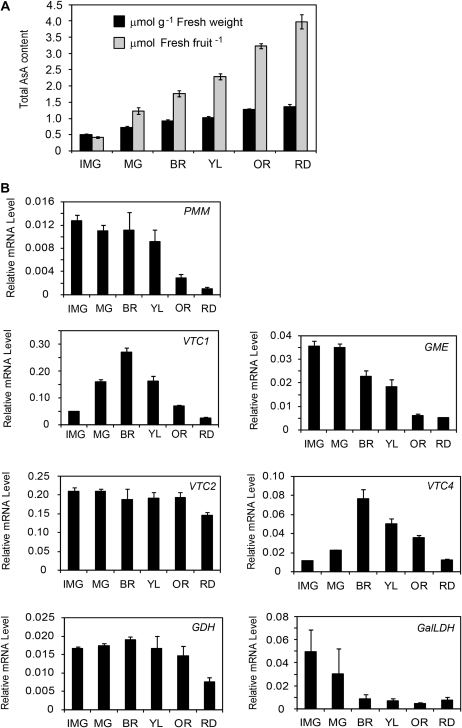
Fig. 2.
The AsA content and expression of AsA biosynthesis genes in Micro-Tom fruits during ripening. (A) Fruits were harvested at six different stages of ripening: immature green (IMG), mature green (MG), breaker (BR), yellow (YL), orange (OR), and red (RD), and the total AsA content measured as μmol per fresh fruit and μmol per gram fresh weight. (B) The expression levels of the genes in the D-Man/l-Gal pathway for AsA biosynthesis. Total RNAs were isolated from the fruits above and transcribed into cDNA for use as template in the real-time PCR; the results were normalized to the expression of EF1α. Values are the mean ±SE (n=3).

