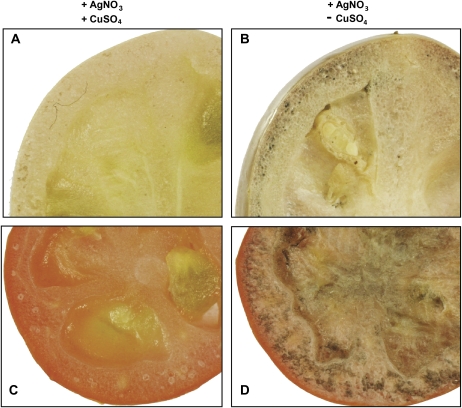
Fig. 3.
Localization of AsA within Micro-Tom fruits. The control images of green (A) and red (C) fruits pre-treated with 5% CuSO4·5H2O and the methanolic AgNO3 stains showing dark patches around the membrane of the green (B) and red (D) fruits. The pictures shown are representative of three repetitions.

