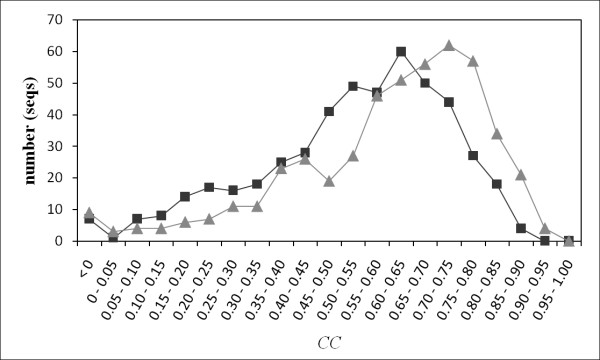
Figure 6.
Distribution of prediction accuracy according to the CC. Squares and triangles respectively represent the number of the sequences that exhibit CC for internal and external motions. The bin is 0.05. The CC and number are shown on the horizontal and vertical axes. These results were obtained using the method that implemented psipred and sable.

