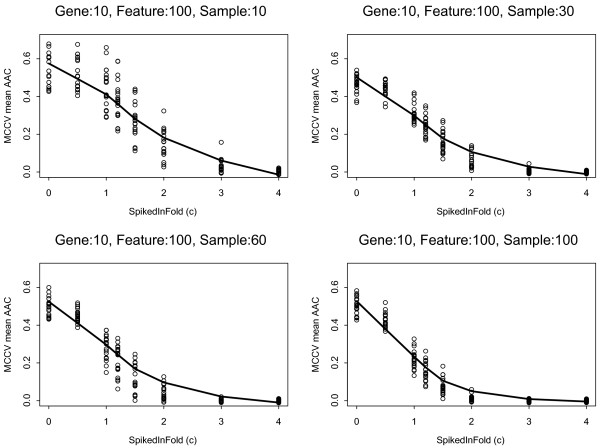
Figure 4.
Classifier performance as function of signature strength and informative sample size when redundant features are also included in the model. The number of spiked probes was set to 10 and the number of features included in the predictor was set to 100. The informative sample sizes were 10, 30, 60, 100 and the log2 fold increases (i.e., c values) were, 0.5, 1.0, 1.2, 1.5, 2.0, 3.0, 4.0. The solid lines indicate the average area above the ROC curve (AAC) from Monte Carlo Cross Validation (MCCV), the dots represent results from 20 iterations of the analysis performed on the MAQC-II data set (n = 233).

