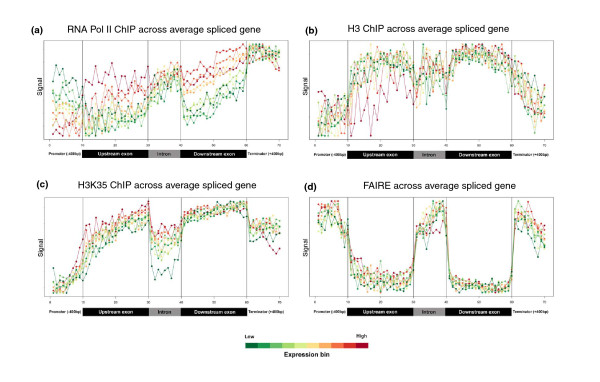
Figure 3.
Profiles of transcription and chromatin-related patterns as a function of gene expression. (a-d) Probe signals for Pol II (a), histone H3 (b), H3K36me3 (c), and FAIRE (d) were used to generate average spliced gene profiles that were grouped into ten ranked bins based on Affymetrix expression data. Scales for the relative data range from each expression bin were used to generate the plots. Identical data plotted on the same absolute y-scale for all expression bins is presented for average spliced and unspliced genes in Figure 4. The color bar at bottom depicts average expression levels of bins (red, high expression; green, low expression), and black vertical lines within each box demarcate different sections within the average gene.

