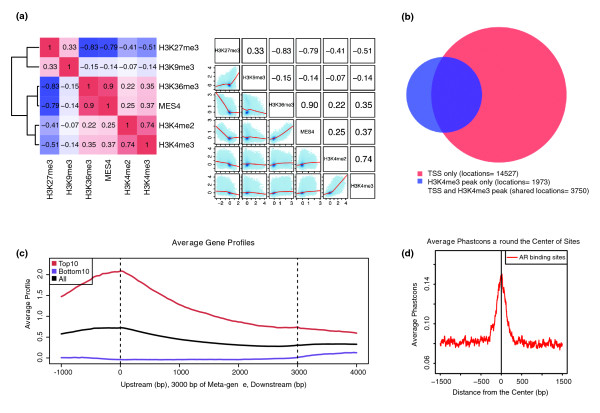
Figure 2.
Correlation and association tools. (a) Correlation plots using different histone marks in C. elegans early embryos [43]. Cistrome correlation tools can generate either a heatmap with hierarchical clustering according to pair-wise correlation coefficients or a grid of scatterplots. (b) Venn diagram showing the overlap of H3K4me3 peaks (in blue) with transcription start sites (TSS) for all the genes (in red) in the C. elegans genome. (c) Meta-gene plot generated by CEAS showing the H3K4me3 signals enriched at gene promoter regions; the top expressed genes (red) have higher H3K4me3 signals than the bottom expressed genes (purple). (d) Conservation plot showing that the human androgen receptor (AR) binding sites from ChIP-chip [24] are more conserved than their flanking regions in placental mammals.

