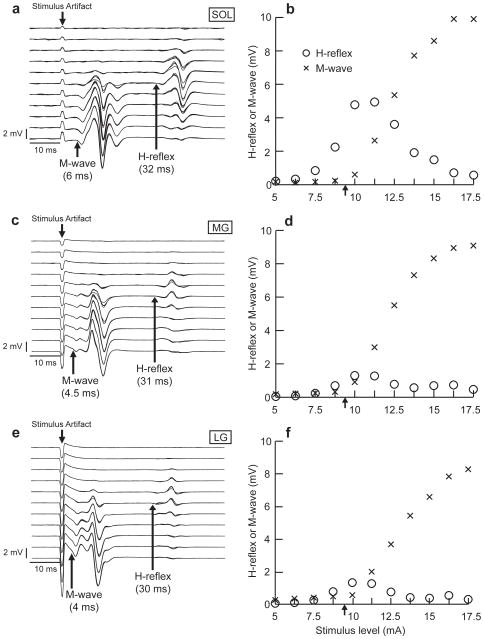
Figure 1.
Examples of typical standing M-waves and H-reflexes at 11 different stimulus levels (a, c, and e) and conventional recruitment curves (b, d, and f) for the soleus (SOL), MG, and LG of one subject. The H-reflexes and the M-waves of the three muscles were recorded simultaneously in response to a series of test stimuli. Their background activity levels were stable throughout. The stimulus level range was 5–17.5 mA, increasing in steps of 1.25 mA (i.e., 11 different levels). In a, c, and e, stimulus level increases from top to bottom, and the arrows indicate the onsets of the M-wave and H-reflex. In b, d, and f, each data point is an average of four responses at the same stimulus level. The Hmax/Mmax ratios were 0.50, 0.14, and 0.16 for the soleus (Mmax 9.9 mV, Hmax 4.9 mV), MG (Mmax 9.1 mV, Hmax 1.3 mV), and LG (Mmax 8.3 mV, Hmax 1.3 mV), respectively. The arrows in b, d, and f indicate the stimulus levels (i.e., just above M-wave threshold) that were used to study the relationships among the SOL, MG, and LG H-reflexes (Figure 2).

