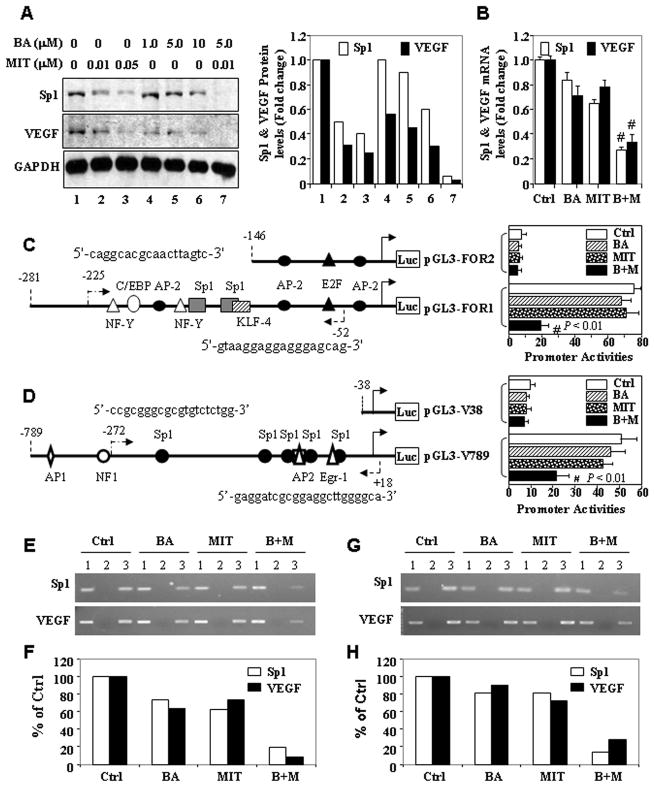
Figure 5.
Treatment with BA and MIT downregulates Sp1 expression in vitro. A, FG cells were incubated in a medium alone or a medium containing different concentrations of BA and/or MIT for 24 h. Total protein lysates were harvested from the cell cultures, and the level of Sp1 and VEGF protein expression was determined using Western blot analysis. Equal protein-specimen loading was monitored by probing the same membrane filter with an anti-GAPDH antibody and changes in gene expression levels were quantitated (A). Total RNA was harvested for qRT-PCR analysis of both Sp1 and VEGF mRNA (B). Sp1 (C) and VEGF (D) promoter reporter constructs were transfected into PANC-1 cells in triplicate and incubated for 12 h. The cells were then incubated for another 24 h in a medium alone or a medium containing 2.5 μM BA, 0.01 μM MIT, or both. Total protein lysates were harvested from the cell cultures for measurement of Sp1 promoter activity using a luciferase assay kit. The relative Sp1 promoter activities in treated groups were expressed as the fold changes from that in their respective control groups. FG (E & F) and PANC-1 (G & H) cells were incubated in vitro in a medium alone or a medium containing 2.5 μM BA, 0.01 μM MIT or both for 24 h and chromatin was extracted from the cells. The ChIP assay was performed using a specific anti-Sp1 antibody and oligonucleotides flanking the VEGF and Sp1 promoter regions containing Sp1-binding sites. The nucleotide positions and sequences of PCR forward and reverse primers flanking those sites in ChIP assay were shown in C and D. *P<0.05 and #P<0.01 (two tailed Student t test). Lane 1, input chromatin DNA; lane 2, chromatin DNA with a control IgG; lane 3, chromatin DNA with an anti-Sp1 antibody. Ctrl, control; M+B, MIT plus BA. Quantitative data were also presented (F & H).

