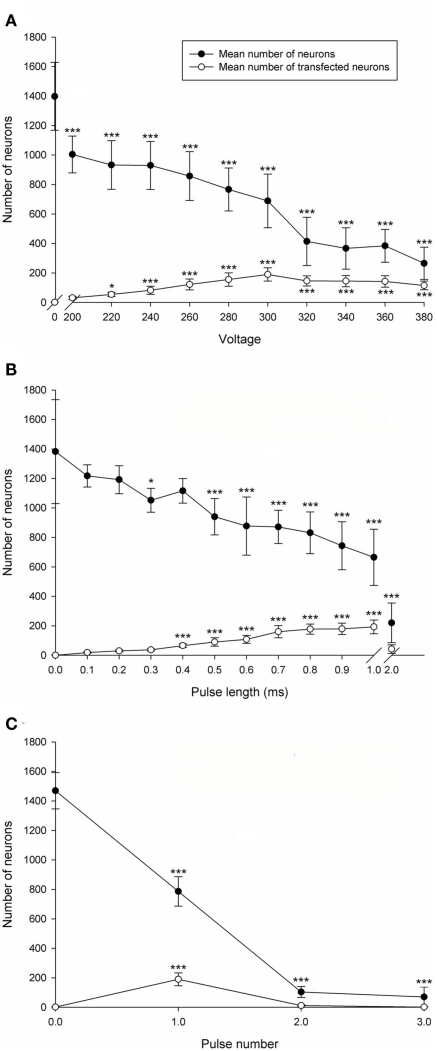
Figure 2.
Electroporation optimization of postnatal rat CGNs. (A) Voltage optimization. The mean number of CGNs was significantly decreased at all voltages compared to the non-electroporated control. The mean number of transfected CGNs significantly increased at voltages higher than 200 V compared to the non-electroporated control. (B) Pulse length optimization. The mean number of CGNs was significantly decreased at pulse lengths higher than 0.4 ms. The mean number of transfected CGNs significantly increased using pulse lengths between 0.4 and 1 ms. (C) Pulse number optimization. The mean number of CGNs was significantly decreased at all pulse numbers. The mean number of transfected CGNs was significantly increased using 1 pulse. Values represent mean and SD; analysis was performed using one way ANOVA with Dunnett’s post hoc tests comparing with the non-electroporated control (*P < 0.05, ***P < 0.001), n = 8.

