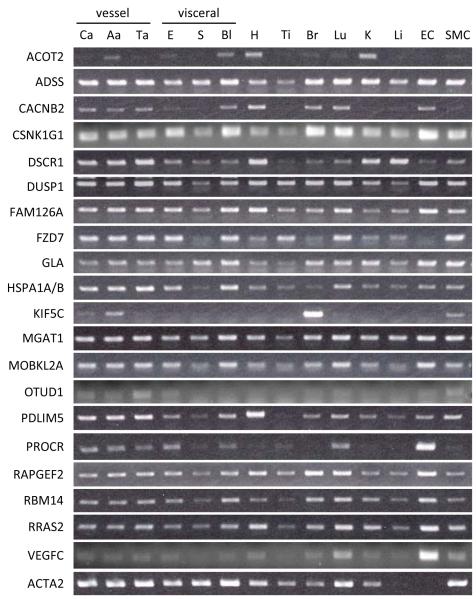
Figure 1. Expression analysis of candidate NFAT-regulated genes in rat tissues and cells.
Agarose gel electrophoresis was performed for PCR amplicon products. Expression levels of each NFAT candidate gene differs depending on tissue and cell type. carotid artery (Ca), abdominal aorta (Aa), thoracic aorta (Ta), esophagus (E), stomach (S), bladder (Bl), heart (H), tibialis anterior (Ti), brain (Br), lung (Lu), kidney (K), liver (Li), aortic endothelial cell (EC), aortic smooth muscle cell (SMC)

