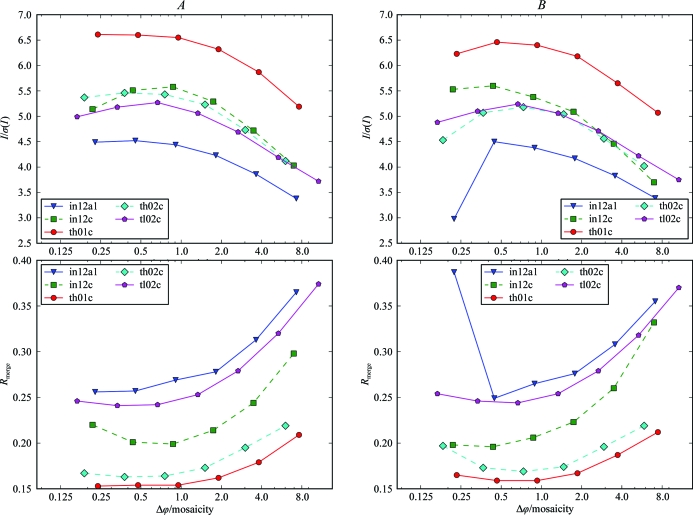
Figure 8.
Comparison of two sets of integration parameters. Two different sets of integration parameters (left panels, parameters A; right panels, parameters B) were used to process the data from five series of data sets. Statistics for I/σ(I) (top panels) and R merge (bottom panels) of the highest resolution shell for each data set are shown. For highly fine-sliced data, better scaling statistics can be obtained with parameters A for most data sets.

