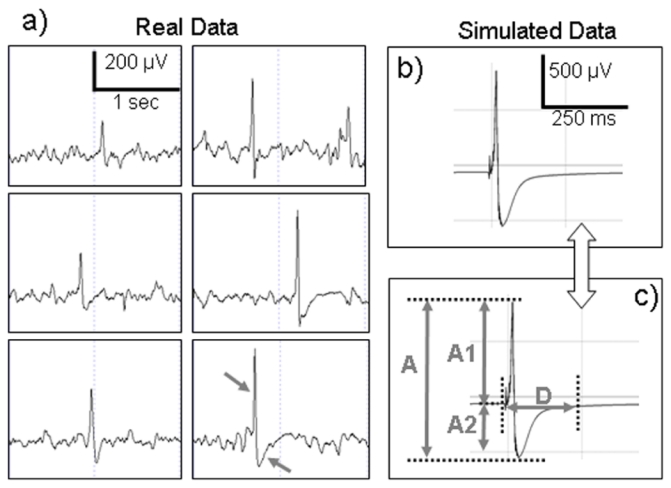
Figure 5.

Comparison between real and simulated data. a) Typical epileptic spikes recorded with depth-EEG electrodes in hippocampus from a patient with TLE. These spikes were sorted according to increasing amplitude. Spikes are typically characterized by a fast early component followed by a slower negative component (arrows in the lower right box in 5-a). This figure shows the variability of interictal events in terms of amplitude and duration. b) Typical epileptic spike simulated from the model. c) Morphological features measured in simulated spikes and analyzed with respect to model parameters. A: peak-to-peak amplitude, A1: Spike component amplitude, A2: Negative wave amplitude D: Duration.
