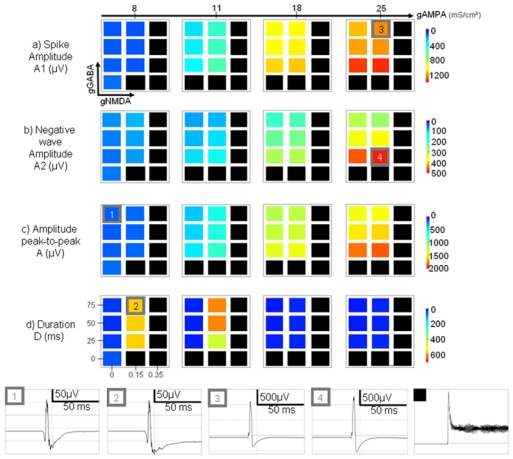
Figure 6.

Color-coded maps showing the influence of model parameters (conductances associated with excitatory and inhibitory currents) on morphological features of simulated epileptic spikes (a-d). Features are coded from blue for weak values to red according to large feature values. For some parameter configurations, the model could generate oscillatory activity. In these cases, the results appear as black squares. See results for details. Right: Examples of morphologic changes induced by parameter variations. 1 → 2: increase of gNMDA leads to longer duration of the negative wave. 1, 2 → 3: increase of gAMPA influences the spike amplitude. 3 → 4: decrease of gGABA leads to a more pronounced negative wave following the positive component of the spike.
