
Figure 2. Confusion matrix for personalized modeling of 20 subjects for 9 activities.
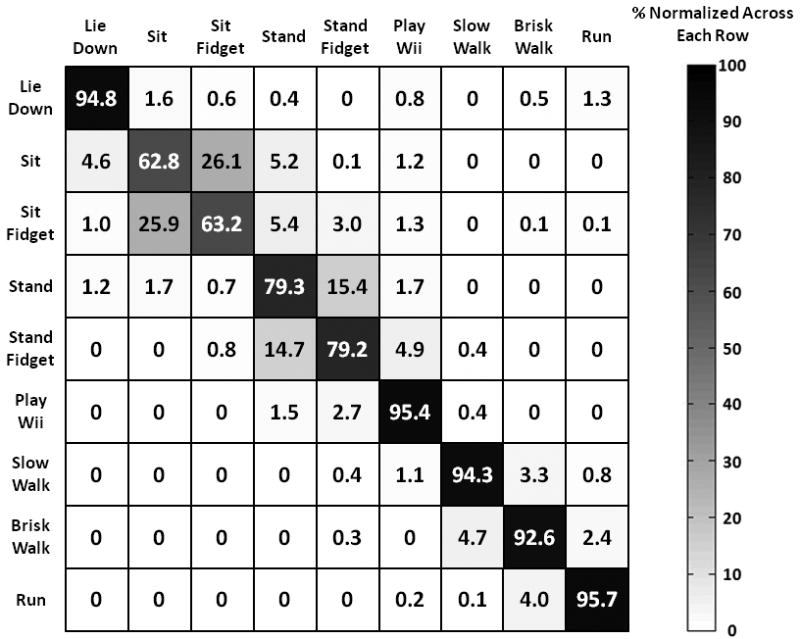
Predicted activity is shown on the X-axis and actual activity is shown on the Y-axis. Correct decisions fall on the diagonal. Percentage of decisions falling into each cell is shown. Cells containing 100% of the decisions are pure black while those cells containing 0% of the decisions are pure white.