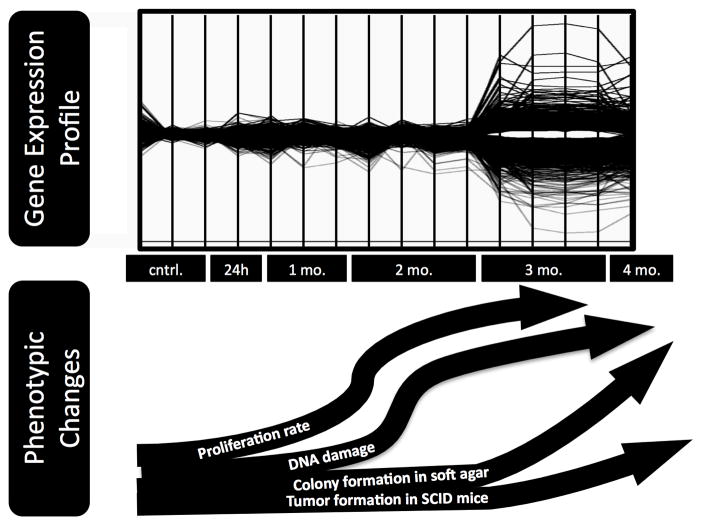
FIGURE 5.
Comparison of observed phenotypic changes with the gene expression profile (from Figure 2) that occurs in UROtsa with continuous exposure to 50 nM MMA(III). The phenotypic changes listed in the curved arrows are reported by Wnek et al. (2010).

