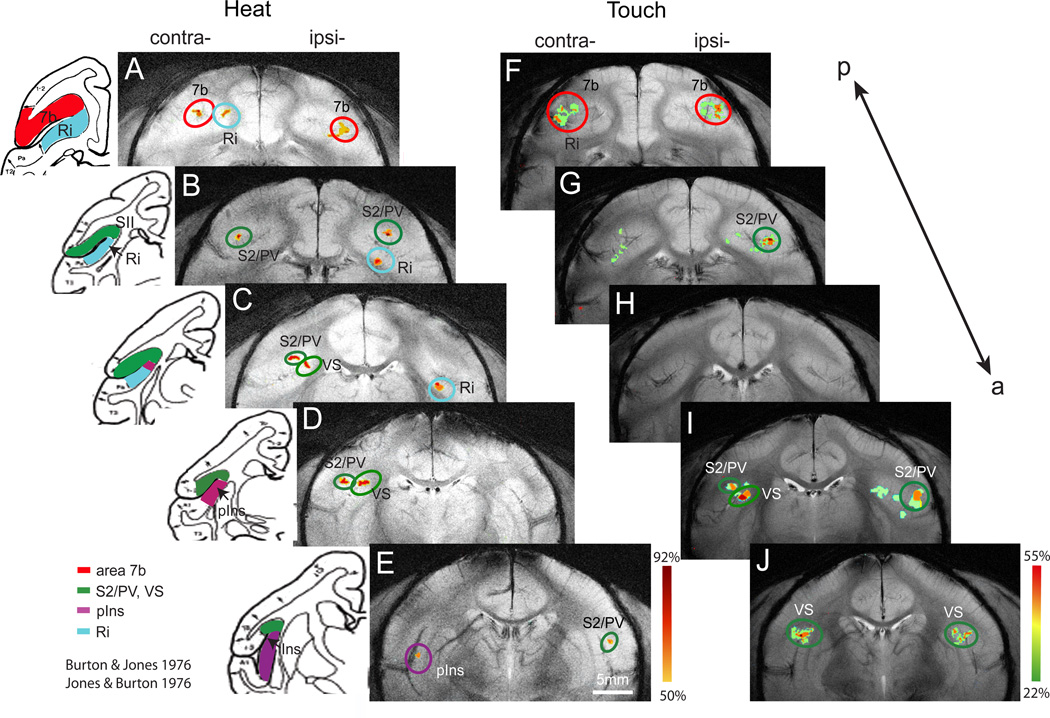
Figure 3.
Probability maps of activation in response to nociceptive heat and innocuous tactile stimulation. A–E. Activation frequency maps for nociceptive heat stimulation of fingers on five consecutive coronal image slices in posterior to anterior order. Color scale next to E indicates the frequency range (50% to 92%) of activation at each location. F–J. Activation frequency maps for innocuous tactile stimulation of fingers on five consecutive coronal image slices. Activation frequency ranges from 22% to 55% across animals (color scale next to J). Left inserts are corresponding schematic illustrations of the cortical areas and inter-areal borders identified by cytoarchitectural features of the brain tissue in the squirrel monkey (adapted and modified from Burton & Jones, 1976 and Jones & Burton, 1976). S2: secondary somatosensory area. PV: ventral parietal somatosensory area. VS: ventral somatosensory area. pIns: posterior insular cortex. Ri: retroinsular. 7b: area 7b.

