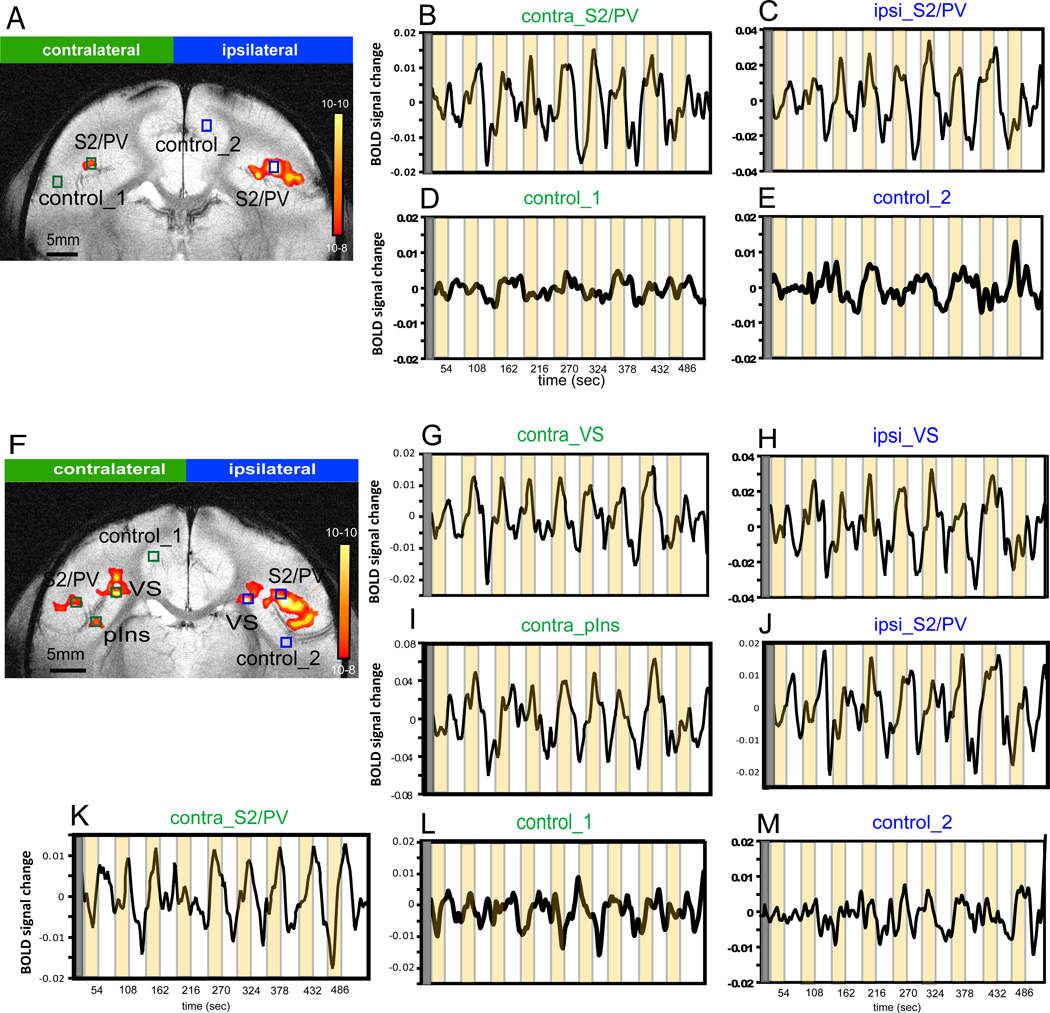
Figure 4.
Single trial BOLD signal plots of single voxels in different ROIs of slice 3 and slice 4 in a representative monkey (M3). A & B. Nociceptive heat stimulus evoked activation maps (threshold at a p-value of 1e-8 and a minimum voxel size of two). Peak response voxels are identified within each activation cluster for time course analysis. B, C, G–K. Single trial BOLD signal changes in contralateral and ipsilateral areas during heat stimulus on (24 sec, orange blocks) and off (30 sec, white intervals) cycles. D, E, L, M. BOLD signal changes in control locations during stimulus presentation. Y axis: arbitrary unit for BOLD signal changes.

