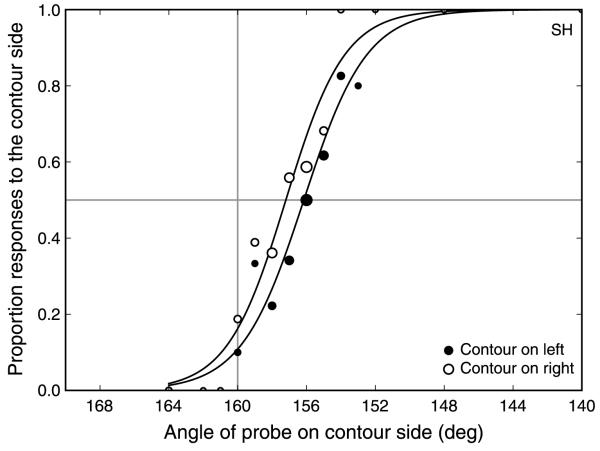
Figure 2.
Sample psychometric functions for compound stimuli on the left (filled symbols) and right (open symbols) of fixation (Experiment 1b, observer SH, adapt SF = 1.1 c/deg, test SF = 0.78 c/deg). Symbol size indicates the relative number of responses underlying each data point (actual numbers vary from 1 to 70 responses per point). The horizontal gray line indicates the point of 50% probability of responding on the compound side. The vertical gray line (160° on x-axis) represents the point of veridical equality. The PSE is calculated from the average of the points where the left and right side functions cross the 50% probability line.

