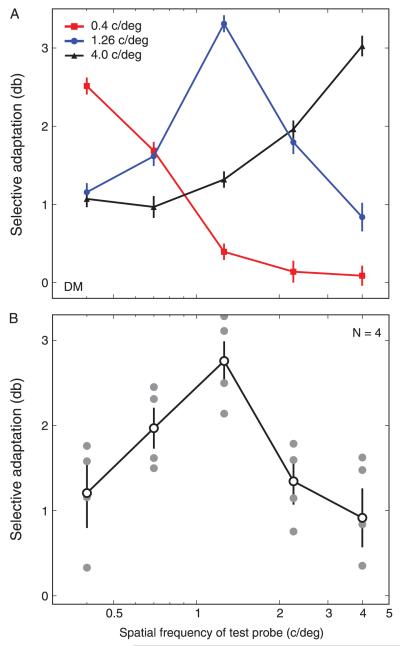
Figure 3.
Magnitude of the plaid adaptation effect for different adapting and test spatial frequencies. (A) Data from observer DM for adapting SFs of 0.4, 1.26, and 4.0 c/deg. Error bars indicate 95% CIs based on 5000 bootstrap re-samples. (B) Individual subject data (filled symbols) and group mean data (open symbols, N = 4) adapting to 1.26 c/deg and testing with SFs between 0.4 and 4 c/deg. Error bars indicate SEM across observers; 0 on the y-axis indicates the point of veridical equality.

