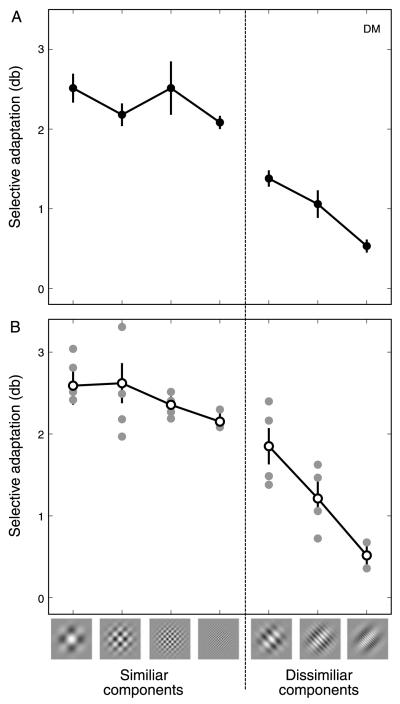
Figure 5.
Magnitude of the plaid adaptation effect for plaids comprised of component gratings with the same or different spatial frequencies. (A) Data from observer DM. Error bars indicate 95% CIs based on 5000 bootstrap re-samples. (B) Individual subject data (filled symbols) and group mean data (open symbols). For the group mean data, the rightmost data points for the similar and dissimilar components represent data from two observers (see General methods section for details). Otherwise, N = 4. Error bars indicate SEM across observers; 0 on the y-axis indicates the point of veridical equality.

